
Main
Agricultural productivity has increased dramatically over the last century. Unfortunately, the fertilizers, growth regulators and pesticides that drove these gains are broadly acting and often applied in excess, which has caused widespread waste and ecological damage1,2. Bacteria with the potential to deliver plant-growth-promoting benefits directly to plants have emerged as promising alternatives to chemical inputs3,4. However, microorganisms may face analogous limitations to chemical inputs5,6,7. Beneficial microorganisms can spread beyond target crops, where they may confer growth benefits that dilute the competitive advantage intended for the crop and cause unintended ecological change8,9.
Solving this problem requires a mechanism to restrict microbial benefits to specific plant hosts and conditions. Previous efforts have explored rhizopines10,11, opines12, sucrose13 and quorum-sensing molecules14,15 as plant-produced signals to control bacterial gene expression. Although effective under the contexts tested, the natural roles of these molecules in interkingdom signaling could limit their orthogonality in synthetic signaling systems intended for sets of engineered organisms.
Noncanonical amino acids (ncAAs), which are amino acids outside the canonical translational repertoire, have potential for expanding the toolbox. Plants naturally produce an estimated 250–300 ncAAs16,17,18. These ncAAs serve as metabolic intermediates, protected nitrogen reservoirs, allelopathic chemicals, signals for systemic acquired resistance and mediators of stress response16,17,18,19,20. Nonnative ncAAs that are absent from natural plant chemical vocabularies could be combined with genetic code expansion (GCE) technologies to program plant–microorganism interactions. GCE technologies now enable site-specific incorporation of more than 200 ncAAs into target proteins within living cells21,22, which creates the opportunity to program bacterial gene expression in response to diverse ncAAs.
Among the hundreds of ncAAs identified to date, O-methyl-L-tyrosine (OMY) is well suited for plant-based control over microbial behavior for several reasons. First, OMY has not been detected in agricultural soils and its known biosynthetic origins are limited to marine Streptomyces spp. and the rice blast fungus Magnaporthe oryzae, where it serves as a biosynthetic precursor for marformycin23 and cytochalasan24, respectively. Thus, OMY has a favorable likelihood of functioning as an orthogonal regulator of bacterial gene expression in agricultural soils. Second, OMY can be synthesized from L-tyrosine in a single enzymatic step by MfnG, an O-methyltransferase from Streptomyces drozdowiczii23, which facilitates its production in heterologous hosts25. Third, OMY was the first ncAA to be site-specifically incorporated within proteins in live bacterial cells26 and robust GCE machinery exists for OMY incorporation27,28. Lastly, it has been demonstrated that OMY can mediate engineered communication between strains of Escherichia coli25.
Here, we establish OMY as a tool for plant-based control over microbial behavior. We demonstrate that the model soil bacterium Bacillus subtilis can incorporate OMY into target proteins through GCE to enable OMY-dependent protein synthesis with a >3,000-fold dynamic range. We show that OMY can be biosynthesized by multiple plant species, including the model plant Arabidopsis thaliana, the vegetable crop Solanum lycopersicum (tomato) and the bioenergy tree Populus tremula × alba (poplar), through heterologous expression of a single biosynthetic enzyme. Plant-derived OMY is sufficient to control bacterial protein synthesis in cocultivation experiments. We show that the system is generalizable across multiple target proteins and functional in a wild bacterial isolate with minimal optimization.
Translating this tool into agricultural applications requires that OMY production does not compromise plant fitness. Relative to plant-produced ncAAs that function as allelopathic compounds, such as meta-tyrosine29 and L-canavanine30, OMY exhibits reduced phytotoxicity. We find that OMY is ~50–200-fold less potent than known allelopathic ncAAs and is not misincorporated into native plant proteins like other allelopathic ncAAs16,17,18,19,29,31. Conditional and tissue-specific production of OMY reduces growth impacts while maintaining effective bacterial signaling. Altogether, this work demonstrates that ncAAs can be used to program plant–microorganism interactions and lays a foundation for precision agriculture applications based on engineered microbial partnerships.
Results
GCE in B. subtilis
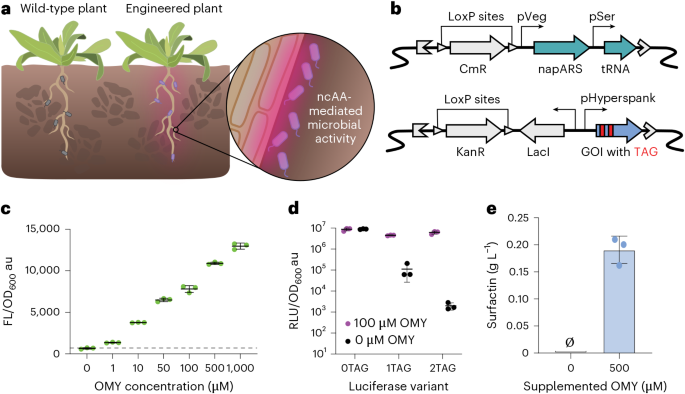
To create bacteria capable of a highly sensitive response to plant-produced OMY (Fig. 1a), we introduced GCE components into B. subtilis PY79 (refs. 27,32). GCE requires an orthogonal aminoacyl-tRNA synthetase/tRNA pair that can charge a suppressor tRNA with the ncAA to enable incorporation at amber stop codons in target genes. We introduced the napARS synthetase derived from the Methanocaldococcus jannaschii tyrosyl-tRNA synthetase (MjTyrRS) and its corresponding suppressor tRNA (tRNATyrCUA)26 under the control of strong constitutive promoters into the B. subtilis PY79 chromosome (Fig. 1b). To assess OMY-dependent protein production, we integrated an mNeonGreen reporter with an amber stop codon near the N terminus at the amyE locus on the B. subtilis chromosome. In the absence of OMY, mNeonGreen translation should terminate at the stop codon, resulting in a truncated protein with no reporter activity. In the presence of OMY, napARS and tRNATyrCUA should facilitate incorporation of OMY at UAG sites to produce a fully functional reporter protein. Testing of the mNeonGreen reporter by titrating exogenous OMY revealed dose-dependent reporter activation, with twofold induction at 1 μM OMY, fivefold induction at 10 μM OMY and 20-fold induction at 1 mM OMY (Fig. 1c). However, we observed substantial background fluorescence in the absence of OMY, indicating incomplete translational termination at the single amber stop codon.
a, OMY platform concept. Plants engineered to secrete a ncAA can activate specific bacterial activity. b, GCE components introduced to B. subtilis to enable OMY-dependent gene expression. An engineered variant of MjTyrRS26 and tRNATyrCUA26 were constitutively expressed by the pVeg73 and pSer27 promoters, respectively. The gene of interest (GOI) was engineered to have an in-frame amber stop codon, TAG, for site-specific ncAA incorporation and was expressed constitutively by a pHyperspank promoter74. A chloramphenicol resistance cassette, CmR75, and kanamycin resistance cassette, KanR76, were used for selection of each construct upon genome integration and both were flanked by LoxP sites77. c, Activity of an OMY-dependent mNeonGreen reporter containing one amber stop codon in B. subtilis PY79 across a range of OMY concentrations in minimal media. The dashed line represents OD-normalized fluorescence with no supplemented OMY. d, Activity of NanoLuc reporters containing zero, one or two amber stop codons in B. subtilis PY79 with 0 µM (black) or 100 µM (purple) OMY supplementation in rich medium (LB). e, OMY-dependent surfactin production measured using HPLC. Data are the mean of three replicates collected simultaneously from three separate cultures. Error bars represent the s.d. and dots are individual data points.
To reduce background activity and improve dynamic range, we switched to the more sensitive NanoLuc luciferase reporter33 and tested the effect of incorporating multiple amber stop codons. We constructed NanoLuc variants with one (position 2) or two (positions 2 and 4) amber stop codons and measured luminescence in the presence and absence of OMY. While all variants showed similar luminescence signals in the presence of OMY, background activity decreased dramatically with the additional amber stop codon (Fig. 1d). The two-stop variant exhibited nearly 55-fold lower background than the single-stop construct, resulting in a total fold change of 3,100-fold with and without OMY (Fig. 1d). This highlights how variation in amber stop codons can alter the stringency of OMY-dependent protein production for conditional gene expression applications.
A key advantage of GCE is that bacterial output can be reprogrammed by introducing amber codons into any gene of interest without changing the tRNA/synthetase machinery. To demonstrate control over a microbially produced compound relevant to plant growth promotion, we engineered OMY-dependent surfactin biosynthesis by introducing a copy of the sfp gene, which encodes the 4′-phosphopantetheinyl transferase enzyme responsible for activating surfactin synthetases34, containing an amber stop codon into B. subtilis chromosome. The engineered strain produced no detectable surfactin in the absence of OMY and ~0.18 g L−1 surfactin with 500 µM OMY (Fig. 1e). Together, these results show that OMY-dependent translation can be used to tightly control expression of diverse bacterial proteins.
Plant biosynthesis of OMY
Next, we engineered plants to produce OMY. We first tested OMY production in plant cells using transient expression of GFP-tagged MfnG (sfGFP–MfnG) in Nicotiana benthamiana leaves (Fig. 2ab). We used the A. thaliana UBQ10 promoter35 to drive expression of sfGFP–MfnG and Agrobacterium tumefaciens infiltration to deliver the construct into plant cells. At 3 days after infiltration, leaves expressing the fusion construct were harvested for liquid chromatography–mass spectrometry (LC–MS) analysis. Extracts from proUBQ10::sfGFP-MfnG leaf tissue contained a metabolite with the expected m/z for OMY and coeluted with a commercial OMY standard, while no signal was detected in control samples (Fig. 2b and Extended Data Fig. 1a). Thus, OMY can be synthesized in plant cells by expressing MfnG.
a, OMY biosynthetic pathway. b, Extracted ion chromatograms at 196.097 m/z from LC–MS analysis of uninfiltrated N. benthamiana leaves (top), N. benthamiana leaves transiently transformed with proUBQ10::sfGFP-MfnG T-DNA (middle) and OMY standard (bottom). Transient expression was achieved through Agrobacterium infiltration (Methods). c, sfGFP expression in homozygous proUBQ10::sfGFP-MfnG seedlings 11 days after stratification. Widefield fluorescence microscopy (500 ms of exposure; left) and composite brightfield images (right). Insets, fluorescence of primary and lateral root tips. Scale bar, 1 cm. d, OMY in growth medium conditioned by hydroponically growing wild-type Col-0 (gray) and proUBQ10::sfGFP-MfnG (magenta) Arabidopsis seedlings. OMY concentration was determined by peak intensity at 196.097 m/z within a retention time range of 4.855–5.139 min (EICs in Extended Data Fig. 1b). Dots represent three technical replicates from one batch of seedlings grown together, 18 seedlings per replicate. Bar plots show the median. Error bars represent the interquartile range. WT, wild type. e, Cocultivation of B. subtilis PY79 expressing the OMY-dependent luciferase reporter containing two amber stop codons with wild-type Col-0 (left) or proUBQ10::sfGFP-MfnG (right) Arabidopsis seedlings. Seedlings were transferred onto bacteria–agar matrix at 8 days after stratification and cocultivated for 4 days before imaging. Composite images overlay brightfield with luminescence (30 s of exposure). The color bar represents luminescence intensity (Fire LUT) (additional images in Extended Data Fig. 2). Scale bar, 1 cm. f, Luminescence intensity profile across the x axis of the plate in e. The line plot connects discrete points representing the vertically averaged pixel intensity at each location. g, Fold change in luminescence intensity, calculated as the ratio of intensity at each peak to the average intensity at adjacent midpoints between peaks. Bar plots show the median and interquartile range for wild-type Col-0 (gray, n = 7) and proUBQ10::sfGFP-MfnG (magenta, n = 8); individual data points represent single peaks. Open circles are from the mixed plate shown in e; closed circles are from separate wild-type and proUBQ10::sfGFP-MfnG plates (Extended Data Fig. 2c). Statistical significance was evaluated using a two-sided Mann–Whitney test (***P = 0.0003).
We then transformed A. thaliana Col-0 with proUBQ10::sfGFP-MfnG using floral dip to generate stable transgenic lines, hypothesizing that biosynthesized OMY could be exuded because tyrosine and many other amino acids are commonly found in root exudate36. Transgenic plants exhibited sfGFP expression in all tissues (Fig. 2c). To quantify OMY exudation, we grew the plants hydroponically. We germinated Arabidopsis seeds on solid medium and transferred 18 6-day-old seedlings into 12 ml of liquid Murashige–Skoog basal salts medium supplemented with 1% sucrose. After 48 h of hydroponic growth, we analyzed the conditioned medium using LC–MS. The proUBQ10::sfGFP-MfnG transgenic plants produced an average of 3.1 µM OMY, whereas no OMY was detected in wild-type controls (Fig. 2d and Extended Data Fig. 1b). Thus, micromolar OMY concentrations can be achieved in bulk root exudate without optimization of metabolic flux or OMY transport and without L-tyrosine supplementation.
Cocultivation of engineered plants and bacteria
To test whether plant-produced OMY could control bacterial protein synthesis, we cocultivated OMY-producing Arabidopsis with B. subtilis expressing OMY-dependent or OMY-independent NanoLuc reporters. We embedded the bacteria in Murashige–Skoog agar medium and transferred Arabidopsis seedlings onto the bacteria–agar matrix for cocultivation (Methods and Supplementary Fig. 1). After 4 days of cocultivation, we applied luciferase substrate and imaged luminescence. The OMY-independent reporter exhibited strong luminescence across the entire plate regardless of plant genotype, while OMY-dependent luciferase activity was only observed near sfGFP–MfnG-expressing plants (Fig. 2e and Extended Data Fig. 2a–c). Plants expressing proUBQ10::sfGFP-MfnG produced strong luminescence peaks with the OMY-dependent reporter (~3.2-fold above midpoint intensity) (Fig. 2f,g and Extended Data Fig. 2c). We also observed small luminescence peaks with the OMY-independent reporter at each seedling (~1.2-fold above midpoint intensity), suggesting that bacterial density may increase near the roots and contribute to a local increase in luminescence signal (Extended Data Fig. 2a). Wild-type plants cocultivated with the OMY-dependent strain showed a similar, 1.4-fold increase in luminescence at the root (Fig. 2f,g and Extended Data Fig. 2c). Excitingly, when OMY-producing transgenic plants were grown side by side with unmodified wild-type plants, the luminescence signal was concentrated around the transgenic plants (Fig. 2e–g). Thus, plant-produced OMY enables genotype-specific induction of bacterial gene expression.
OMY effects on plant and bacterial growth
Some plant-produced ncAAs function as allelopathic compounds that suppress the growth of competitor plants16,17,18,19,20. We noticed that transgenic plants ubiquitously expressing sfGFP–MfnG displayed reduced primary root length, decreased lateral root density and impaired gravitropism compared to wild-type Col-0 (Fig. 3a–d). These phenotypes were consistent across multiple independent homozygous lines, suggesting that the growth defects result from sfGFP–MfnG overexpression rather than random T-DNA insertion effects (Extended Data Fig. 3a,b). Addition of OMY to bacterial growth medium did not affect bacterial growth rate (Extended Data Fig. 4a,b).
a, Representative images of wild-type Col-0 (left) and proUBQ10::sfGFP-MfnG (right) Arabidopsis seedlings 11 days after stratification. b–d, Primary root length (****P < 0.0001) (b), lateral root density (NSP = 0.2695 (NS, not significant), ****P < 0.0001) (c) and gravitropism score (**P = 0.0018) (d) of wild-type Col-0 (gray, n = 9) and proUBQ10::sfGFP-MfnG (magenta, n = 23) Arabidopsis plants phenotyped at 11 days after stratification. The box plot central bars show the median, hinges indicate the first and third quartiles and whiskers indicate minima and maxima. Two-sided Mann–Whitney tests were used to evaluate statistical significance. ****P < 0.0001 and **P < 0.01. Primary root length was measured from the root–hypocotyl junction to the root tip. Lateral root density was calculated as the number of emerged lateral roots divided by total primary root length. Gravitropism score was calculated as the ratio of the vector length to primary root length. e, Dose–response curves for OMY inhibition of primary root length in wild-type Col-0 seedlings at 6 days (gray) and 11 days (black) after stratification. Representative images of seedlings at 6 days after stratification are shown. Dots are the median of 10, 9, 11, 10, 12 and 12 seedlings for concentrations of 1, 10, 50, 100, 500 and 1,000 µM OMY, respectively. Error bars represent the interquartile range. IC50 curves were fitted with Prism (Methods) (R2 > 0.99 for both curves). f,g, Volcano plots showing differential abundance of peptides containing O-methylated tyrosines (+14.0156 Da) in wild-type versus proUBQ10::sfGFP-MfnG shoots (f) and roots (g) harvested at 14 days after stratification (n = 3). Each dot is a unique peptide. Fold change was calculated as the mean abundance in proUBQ10::sfGFP-MfnG samples divided by mean abundance in wild-type samples. Hyperbolic curves show thresholds for statistical significance determined with modified two-sided Student’s t-tests (curvature parameter (S0) = 1.5, FDR = 0.05). FC, fold change. h, Germination of wild-type Col-0 (gray) and proUBQ10::sfGFP-MfnG (magenta) Arabidopsis seeds over time. Unless otherwise stated, all panels show the same homozygous T3 proUBQ10::sfGFP-MfnG line (event 1). Scale bars, 1 cm.
To assess the potential phytotoxicity of OMY, we treated wild-type Arabidopsis seedlings with OMY and measured primary root length. We observed concentration-dependent growth impairment and determined a half-maximal inhibitory concentration (IC50) of ~94–101 µM (Fig. 3e). This makes OMY ~50–200-fold less potent than known allelopathic ncAAs such as meta-tyrosine (IC50 of 2.4 µM)29 and L-canavanine (IC50 of ~0.5 µM)30. The concentration of OMY required to match the growth phenotype of proUBQ10::sfGFP-MfnG plants was ~100–127 µM, which is consistent with constitutive overexpression driving substantial OMY accumulation in planta.
We investigated potential mechanisms underlying OMY-mediated growth inhibition. First, we tested whether inhibition resulted from depletion of aromatic amino acid precursors, which could occur through feedback inhibition of shikimate pathway enzymes37. However, supplementation with L-tyrosine (Extended Data Fig. 5a) or L-phenylalanine (Extended Data Fig. 5b) failed to rescue the growth phenotypes of OMY-producing plants. Next, we examined whether OMY phytotoxicity results from misincorporation into native proteins, which is a common mechanism of ncAA-dependent allelopathy16,17,18,19,29,31. Proteomics analysis did not detect significantly elevated levels of O-methylated L-tyrosine residues in proUBQ10::sfGFP-MfnG transgenic plants compared to the wild type (Fig. 3f,g and Extended Data Fig. 5c,d). Thus, we did not find evidence to support OMY misincorporation as the mechanism for toxicity.
Additional OMY phenotypes support a potentially novel mechanism of ncAA toxicity. proUBQ10::sfGFP-MfnG seeds exhibited delayed germination and reduced final germination percentages compared to the wild type (Fig. 3h). proUBQ10::sfGFP-MfnG seed viability also declined more rapidly than Col-0, dropping from 90% germination at 3 months to 60% at 14 months (Extended Data Fig. 5e). Yet, exogenous OMY treatment of wild-type seeds had a minimal effect on germination (Extended Data Fig. 5f). These germination phenotypes suggest OMY accumulation during seed development contributes to fitness costs in constitutively expressing lines.
Conditional biosynthesis of OMY in planta
To mitigate fitness costs while maintaining bacterial control, we engineered tissue-specific and inducible expression of MfnG. We selected the Arabidopsis BEARSKIN1 (BRN1) promoter38 for root-cap-specific expression, hypothesizing that this would limit systemic OMY accumulation while preserving rhizosphere accumulation. Transgenic Arabidopsis expressing proBRN1::sfGFP-MfnG displayed sfGFP signal exclusively in the root caps (Fig. 4a). In parallel, we engineered β-estradiol-inducible expression using the XVE system39. proXVE::sfGFP-MfnG plants showed no detectable sfGFP before treatment but strong expression 24 h after β-estradiol application (Fig. 4b).
a, sfGFP expression in homozygous proBRN1::sfGFP-MfnG seedlings 11 days after stratification. Widefield fluorescence microscopy (left; 500 ms of exposure) and composite brightfield images (right). Insets, fluorescence of primary and lateral root tips. b, sfGFP expression in T1 hemizygous transformants of proXVE::sfGFP-MfnG seedlings at 0 h (left) and 24 h (right) after transfer to medium containing 20 µM ꞵ-estradiol (150 ms of exposure in the GFP channel). Scale bars, 1 cm (a,b). c–e, Primary root length (****P < 0.0001 and **P = 0.0080) (c), lateral root density (****P < 0.0001) (d) and gravitropism score (***P = 0.0003 and **P = 0.0010) (e) of wild-type Col-0 (gray; n = 21), proBRN1::sfGFP-MfnG (yellow; n = 21) and proXVE::sfGFP-MfnG (blue; n = 41) Arabidopsis plants, phenotyped 11 days after stratification. The box plot central bars show the median, hinges indicate the first and third quartiles and whiskers indicate minima and maxima. Statistical significance was evaluated using a two-sided Kruskal–Wallis test with Dunn’s post hoc analysis. f, Germination of wild-type Col-0 (gray), proBRN1::sfGFP-MfnG (yellow) and proXVE::sfGFP-MfnG (blue) Arabidopsis seeds by 6 days after stratification. g, Cocultivation of OMY-dependent B. subtilis PY79 luciferase reporter strain (as in Fig. 2e) with proBRN1::sfGFP-MfnG seedlings. Scale bars, 1 cm. h, Luminescence intensity profile across the x axis of the proBRN1::sfGFP-MfnG plate in g (orange) and wild-type Col-0 plate in Extended Data Fig. 2c (gray). i,j, Fold change (***P = 0.0002) (i) and maximum luminescence intensity (**P = 0.001) (j) luminescence intensity for wild-type Col-0 (gray; n = 5) and proBRN1::sfGFP-MfnG (orange; n = 5) samples in h. Statistical significance was evaluated using a two-sided Welch’s test. Dots indicate individual biological replicates (n = 5 seedlings). The bar plot denotes the median and error bars represent the interquartile range. k, Cocultivation of OMY-dependent B. subtilis PY79 luciferase reporter strain (as in Fig. 2e) with proXVE::sfGFP-MfnG seedlings (event 1, rightmost three; event 2, leftmost three). ꞵ-estradiol (0 µM, top; 20 µM, bottom) was added to the bacteria–agar matrix to induce sfGFP–MfnG expression. Scale bars, 1 cm. l, Luminescence intensity profile across the x axis of the proXVE::sfGFP-MfnG plates in k. m,n, Fold change (NSP = 0.1619) (m) and maximum luminescence intensity (***P = 0.0006) (n) for proXVE::sfGFP-MfnG with 0 µM (light blue) or 20 µM (dark blue) ꞵ-estradiol. Statistical significance was evaluated using a two-sided Welch’s test. Dots indicate individual biological replicates (n = 6 seedlings). The bar plot denotes the median and error bars represent the interquartile range. All panels used proBRN1::sfGFP-MfnG event 4 and proXVE::sfGFP-MfnG events 1 and 2.
Both proBRN1::sfGFP-MfnG and proXVE::sfGFP-MfnG plants exhibited substantially improved growth compared to constitutive proUBQ10::sfGFP-MfnG plants, with primary root length, lateral root density and gravitropic response all closer to or indistinguishable from the wild-type (Fig. 4c–e). Phenotypes varied minimally across independent T-DNA insertion lines (Extended Data Fig. 3a,b). Germination rates were comparable to the wild type at nearly 100% (Fig. 4f). Thus, conditional OMY production largely alleviates the fitness cost of constitutive MfnG overexpression.
We next tested whether conditional expression produces sufficient OMY for bacterial control. LC–MS analysis of conditioned medium detected OMY in proBRN1::sfGFP-MfnG samples, albeit at lower concentrations than proUBQ10::sfGFP-MfnG (0.73 µM from 50 root-cap-specific seedlings versus 3.1 µM from 18 ubiquitously expressing seedlings cultured in 12 ml of medium), which is consistent with BRN1 expression being restricted to ~19% of root cells38,40. Because this concentration falls below the initially characterized range (Fig. 1c), we tested incorporation at lower OMY concentrations. Using flow cytometry to sensitively measure OMY-dependent mNeonGreen fluorescence, we found induction at OMY concentrations as low as 0.05 µM (1.67-fold) and 0.5 µM (7.7-fold) (Extended Data Fig. 4c). Thus, the reporter remains sensitive to OMY below the 1 µM tested with plate reader fluorescence. In cocultivation assays, proBRN1::sfGFP-MfnG plants activated OMY-dependent NanoLuc expression ~2.2-fold above midpoint intensity (Fig. 4g–j and Extended Data Fig. 2c). Although luminescence was lower than observed with proUBQ10::sfGFP-MfnG plants, peaks at individual plant locations remained well defined.
Inducible expression of MfnG enabled strong induction of the bacterial reporter. We applied β-estradiol at the start of proXVE::sfGFP-MfnG plant cocultivation with OMY-dependent bacteria by mixing it into the agar as it cooled. After 4 days of cocultivation, induced plants (20 µM β-estradiol) showed a ~18.7-fold increase in maximum luminescence intensity compared to uninduced plants (0 µM β-estradiol) (Fig. 4k–n). However, the fold change (peak/midpoint) in luminescence was not significantly different between induced and uninduced plants because luminescence did not decay to the same baseline observed in uninduced plants between peaks (Fig. 4l,m). Altogether, these results show that conditional OMY production maintains effective bacterial control while reducing growth inhibition.
Engineering OMY-dependent gene expression in a plant-growth-promoting bacterium
B. subtilis PY79 is a well-characterized model for Gram-positive soil bacteria but its field application is limited. Therefore, we extended the OMY platform to B. subtilis UD1022, a wild isolate that colonizes Arabidopsis roots and was previously reported to promote plant defense and growth41.
We first engineered B. subtilis UD1022 with the same GCE components used in the model strain B. subtilis PY79 and tested OMY-dependent mNeonGreen expression. UD1022 exhibited dose-dependent fluorescence similar to PY79 (Fig. 5a and Extended Data Fig. 4d). We next tested the activity of NanoLuc reporters containing varying numbers of amber stop codons. While the single-amber variant showed robust OMY-dependent luminescence in UD1022, the two-amber variant only reduced background fourfold and decreased maximal signal. Consequently, the optimal fold change for UD1022 (111-fold) was achieved with one amber codon, which differs from PY79 that demonstrated maximum luminescence fold change with two amber codons (Fig. 5b). Similar to PY79, supplementation of OMY to growth medium did not impact the growth rate of UD1022 (Extended Data Fig. 4e,f).
a, Activity of an OMY-dependent mNeonGreen reporter in B. subtilis UD1022 across a range of OMY concentrations in minimal medium. b, Activity of NanoLuc reporters containing zero, one or two amber stop codons in B. subtilis UD1022 with 0 µM (black) or 100 µM (purple) OMY supplementation in rich medium (LB). In a,b, data are the mean of three replicates collected simultaneously from three separate cultures; error bars represent the s.d. and dots are individual data points. c,d, Representative flow cytometry histograms of 10,000 events of UD1022 strains harboring an OMY-independent mNeonGreen reporter (green) or OMY-dependent mNeonGreen reporter extracted from autoclaved soil supplemented with 0 µM OMY (black) or 500 µM OMY (pink). Cells were extracted from the soil 1 day (c) or 3 days (d) after inoculation. e, Median fluorescence for the same strains and conditions as c,d at 1 day and 3 days after inoculation for three replicates. Error bars represent the s.d. f, Cocultivation of B. subtilis UD1022 expressing the OMY-dependent luciferase reporter containing two amber stop codons with wild-type Col-0 (top) or proUBQ10::sfGFP-MfnG (bottom) Arabidopsis seedlings. Composite images overlay luminescence (10 s of exposure) and brightfield. Seedlings were transferred to the bacteria–agar matrix at 10 days after stratification and cocultivated for 4 days. The color bar represents the luminescence intensity (Fire LUT) (additional images in Extended Data Fig. 6). Scale bars, 1 cm.
To test OMY-dependent gene expression in a more field-relevant environment, we inoculated autoclaved soil with the UD1022 mNeonGreen (1UAG) reporter strain and supplemented the soil with 500 μM OMY (Extended Data Fig. 6a). After 1–3 days, we quantified mNeonGreen expression by washing the soil with PBS, filtering out soil particles and quantifying fluorescence by flow cytometry. Median fluorescence increased 41-fold between 0 μM and 500 μM OMY treatment on day 3, indicating robust OMY incorporation in soil (Fig. 5c–e).
Next, we tested whether plant-produced OMY could activate the UD1022 reporter in soil. We grew proUBQ10::sfGFP-MfnG or wild-type seedlings in autoclaved soil for 11 days and then inoculated the soil with UD1022 expressing the OMY-dependent mNeonGreen reporter. After 3 days of cocultivation, we extracted bacteria for flow cytometry analysis. Bacteria containing the OMY-dependent mNeonGreen reporter showed elevated median fluorescence (802 a.f.u.) when cocultivated with proUBQ10::sfGFP-MfnG plants compared to wild-type controls (530 a.f.u.). The total fluorescent population also increased from 9.8% to 36.1%, demonstrating plant-to-microorganism OMY transfer in soil (Extended Data Fig. 6b–d).
To visualize spatial patterns of bacterial activity, we cocultivated UD1022 expressing the OMY-dependent NanoLuc reporter with proUBQ10::sfGFP-MfnG Arabidopsis on agar. UD1022 displayed luminescence patterns similar to PY79, with signal brightest at the root tips despite ubiquitous MfnG expression (Fig. 5f and Extended Data Fig. 7). The root tip signal was more pronounced with UD1022, which may reflect its greater ability to use root exudates for growth. These results demonstrate that OMY-mediated control extends to wild soil bacteria with minimal optimization and functions in both agar and soil environments.
Introducing OMY production to crop species
To demonstrate agricultural applicability, we extended OMY biosynthesis to tomato (S. lycopersicum cv. Heinz 1706 (ref. 42)) and poplar (P. tremula × alba INRA 717-1B4 (ref. 43)). Because generating stable transgenics in these species is time consuming, we used Rhizobium rhizogenes-mediated hairy root transformation for rapid proof of concept. In this process, R. rhizogenes transfers T-DNA into plant cells at wound sites, triggering the formation of transgenic adventitious roots44 (Fig. 6a). The resulting composite plants contain wild-type shoots and a mixture of transgenic hairy roots and nontransgenic roots emerging from the shoot45 (Extended Data Fig. 8).
a, Hairy root transformation method for tomato composite plants. Roots were removed from 8-day-old seedlings and inoculated with R. rhizogenes carrying the genes of interest. R. rhizogenes transfers its T-DNA into tomato cells, which induces hairy root growth and produces composite plants with wild-type shoots and a mixture of transgenic (magenta) and nontransgenic (gray) roots. b, Cocultivation of composite tomato (top) and poplar (bottom) plants with B. subtilis PY79 expressing an OMY-dependent luciferase reporter. Composite images overlay luminescence (30 s of exposure) and brightfield. Images were collected after 5 days (tomato) and 4 days (poplar) of cocultivation with bacteria. The color bar represents luminescence intensity (Fire LUT). Scale bars, 1 cm.
We transformed tomato seedlings and poplar explants with proUBQ10::mStaygold-MfnG constructs (Extended Data Fig. 8). Cocultivation of composite plants with PY79 expressing the OMY-dependent NanoLuc reporter for 4–5 days resulted in luminescence localized to fluorescent-marker-expressing transgenic roots in both species (Fig. 6b). These results demonstrate that OMY biosynthesis and bacterial control are extensible to agriculturally relevant crop species.
Discussion
Our work establishes the ncAA OMY as a tool for plant-based control of microbial activity. By combining OMY biosynthesis in plants with bacterial GCE, we empower plants to direct bacterial gene expression. The system operates with high specificity, which is visible in cocultivation experiments where the luminescence signal from engineered bacteria concentrates around transgenic plants growing alongside wild-type neighbors. Although we found that OMY exhibits mild phytotoxicity, this occurs through a mechanism distinct from known allelopathic ncAAs29,30 and conditional OMY biosynthesis can ameliorate fitness costs while maintaining bacterial control. Future work can explore additional hypotheses for OMY toxicity, including competitive inhibition of aromatic amino acid transporters and biosynthetic enzymes46, interference with auxin biosynthesis or signaling (consistent with impaired root gravitropism)47 and interference with gibberellic acid biosynthesis or signaling (consistent with reduced germination)48, as well as methods for amelioration.
Future work can also optimize the system for agricultural soils, where resident bacteria and environmental fluctuations may degrade OMY, influence incorporation and make it difficult for engineered strains to compete in the rhizosphere. Greater ncAA sensitivity, achieved through engineering of the aminoacyl-tRNA synthetase/tRNA pair for greater translation efficiency at low ncAA concentrations49, may make signaling more robust to these fluctuations without requiring phytotoxic levels of OMY production. Engineering natural field isolates may help to address colonization and competition challenges. However, we found that the maximum fold change required different amber codon configurations in PY79 and UD1022. This may reflect variation in amber suppression efficiency27,50,51, background translational termination fidelity52,53 or ncAA transport and availability54,55 between strains. Thus, field deployment may require optimization of the orthogonal translation system and the amber codon number in each bacterial strain with plant hosts in the target environment. Testing this system in nonsterile soils with diverse native microbial communities will also be important for evaluating potential off-target effects and confirming that OMY-based signaling remains specific to engineered strains in complex, multispecies environments.
Interestingly, bulk measurements of OMY did not reflect the level of reporter activation at plant roots in cocultivation experiments. This is likely because bulk measurements underestimate OMY concentration at the root, where bacteria contact the plant directly56,57. Although OMY concentration gradients may explain the strong luminescence of OMY-dependent reporter strains grown with MfnG-expressing plants, the OMY-independent reporter also showed a modest increase in luminescence near the roots of every plant genotype, suggesting that bacterial cell density may increase near the roots58 and contribute to a local boost in luminescence signal. Although we did not directly measure OMY concentration or bacterial cell density at the root, labeling bacteria with a constitutive fluorescent marker, quantifying OMY and measuring bacterial CFU extracted from the gel matrix at different plate locations would help assess the contribution of chemical and cell concentration gradients to reporter signals.
Here, we extend GCE technology from intracellular protein engineering to programmable interactions between organisms. GCE has largely focused on engineering additional chemistries within a single organism59, including exogenous supply of synthetic ncAAs to control gene expression through the use of translational switches27,60 and survival of engineered microorganisms61,62. Pioneers in the field have long speculated that these kinds of orthogonal biological systems would improve biosafety of engineered organisms by enabling development of a ‘genetic firewall’ that would limit horizontal gene transfer63,64,65. Although these tools and principles each pertain to applications in environmental biotechnology, prior work has not realized the creation of a self-sufficient pair of engineered organisms sharing a private communication channel using GCE. One exception is our own recent work, where we demonstrated a proof of concept of ecological control of gene expression and survival among two engineered E. coli strains25. The system that we present here represents a proof of concept that GCE can link plants and environmentally relevant microorganisms across kingdoms using an ncAA as the shared signal, with autonomous and spatiotemporally controlled synthesis of the ncAA by a multicellular organism.
NcAA-enabled plant-based control of microbial activity has the potential for diverse future applications. While we demonstrated control over reporter expression and surfactin biosynthesis, the same approach could be used to regulate the production of other plant-growth-promoting proteins, such as biosynthetic enzymes for antipathogen compounds, metal chelators and mineral-solubilizing enzymes66,67. Similarly, tissue-specific and inducible expression of MfnG could be extended to engineer systems where bacterial activity responds to plant perception of stress, nutrient status or developmental cues68. Excitingly, ncAAs open the door to biosynthesis of proteins with nonnatural chemistries in the rhizosphere69,70. By incorporating ncAAs into select proteins, engineered microorganisms may make entirely new molecules for plants. The overall concept we present here is also readily extensible to other ncAAs. Hundreds of ncAAs have been identified in nature16,71 and dozens more can be accessed through designed semisynthetic pathways72. Development of mutually orthogonal tRNA/synthetase pairs could enable multiplexed signaling where different plant cues trigger distinct bacterial responses. Altogether, ncAAs represent a vast and largely untapped vocabulary for engineering plant control over their microbiomes.
Methods
Bacterial strains and growth conditions
E. coli strains NEB10β and DH5a were used to construct all plasmids. A. tumefaciens strain GV3101 containing helper plasmid pSoup (TetR) was used for all Arabidopsis and Nicotiana transformations78. R. rhizogenes strain K599 (Intact Genomics, 1087) was used for all hairy root transformations. All B. subtilis strains were derived from the prototrophic laboratory strain PY79 (refs. 32,79) or root isolate UD1022 (ref. 41). E. coli and Agrobacterium strains were grown in Luria–Bertani (LB) Lenox medium (Sigma L3022) in incubating shakers at 250 rpm (New Brunswick Scientific Innova 44) at 37 °C (E. coli) or 28 °C (Agrobacterium). Antibiotics were used at the following concentrations unless otherwise noted: carbenicillin 100 μg ml−1 (GoldBio, C-103), kanamycin 50 μg ml−1 (GoldBio, K-120), spectinomycin 100 μg ml−1 (Sigma, S4014), gentamycin 50 μg ml−1 (GoldBio, G-400), rifampicin 15 μg ml−1 (GoldBio, R-120) and tetracycline 10 μg ml−1 (GoldBio, T-101). All strains used in this study can be found in Supplementary Table 1.
Recombinant DNA construction
All constructs in this study were generated using Assembly80, Golden Gate81 and/or overlap extension PCR. DNA parts (promoters, coding sequences and terminators) were cloned using Gibson assembly into starting plasmids (level 0), with flanking BsaI cut sites. Cassettes composed of promoters, coding sequences and terminators were assembled using Golden Gate reactions to generate constructs (20-µl total reaction volume: 2 µl of 10× T4 ligase buffer, 2 µl of BsaI-HF and 1 µl of T4 DNA ligase; New England Biolabs). All constructs and construction primers used in this study can be found in Supplementary Tables 2 and 3. Linearized DNA fragments for cloning in B. subtilis were generated with homemade Gibson assembly mixtures combining three distinct pieces: (1) an upstream region containing homologous DNA with the chosen genomic insertion site, antibiotic resistance cassette, regulator and promoter (if applicable); (2) the reporter of interest; and (3) a downstream region containing homologous DNA with the chosen genomic insertion site including the native terminator.
B. subtilis strain construction
Transformation of genomic, plasmid or linearized DNA into B. subtilis followed a natural competency protocol. The parent strains were streaked onto LB (Lennox) plates the day before transformation. Freshly grown colonies were inoculated into 1 ml of transformation medium referred to as MC medium (100 mM potassium phosphate (monobasic: Sigma-Aldrich, P9791; dibasic: Sigma-Aldrich, P9666), 3 mM trisodium citrate (Alfa Aesar, A12274), 2% D-glucose (TCI America, G004825G), 22 mg ml−1 ferric ammonium citrate (Alfa Aesar, A11199), 0.1% casein hydrolysate (Sigma-Aldrich, 22090) and 0.2% L-glutamic acid monopotassium salt (Alfa Aesar, A17232)) supplemented with 3 μl of 1 M magnesium sulfate (Sigma-Aldrich, M7506) and grown for 4 h at 37 °C in a roller drum (Thermo Scientific Cel-Gro Tissue Culture Rotator Model 1640). Then, 200 μl of culture was mixed with 1,000 ng of linear DNA, 250 ng of plasmid DNA or 5 μl of B. subtilis genomic DNA for transformation. Cultures were incubated at 37 °C in a roller drum for another 2 h and then plated on LB agar plates containing the appropriate antibiotics (10 μg ml−1 kanamycin (Sigma-Aldrich, K4000) or 5 μg ml−1 chloramphenicol (Sigma-Aldrich, C0378)). Single colonies were picked and verified by sequencing of purified colony PCR products. For colony PCR, individual B. subtilis colonies were suspended in 50 μl of Tris–EDTA buffer (10 mM Tris (Sigma-Aldrich, 252859) and 1 mM EDTA (Sigma-Aldrich, E9884), pH adjusted to 8.0 with NaOH/HCl) and then frozen at −20 °C for 15 min to lyse the cells. Next, 1–2 μl of the thawed cellular mixture was used as a PCR template.
Antibiotic resistance genes were removed according to protocols based on Cre recombinase activity82. Briefly, strains were transformed with the pDR244 plasmid. Transformants were streaked on LB agar containing no antibiotics and grown overnight at 42 °C, after which strains were streaked out on medium containing the original antibiotic the strain was resistant to, spectinomycin (final concentration: 100 μg ml−1) or no antibiotic to confirm proper curing of the plasmid and antibiotic resistance gene.
Genomic DNA extraction
B. subtilis genomic DNA was extracted using a modified protocol for the Qiagen DNeasy blood and tissue extraction kit (Qiagen, 69504). The strain of interest was streaked out on an LB agar plate and grown overnight at 37 °C. A culture was inoculated in LB from a colony and grown to an optical density at 600 nm (OD600) of 1.0 at 37 °C shaking for 4–6 h. Cells were then pelleted and resuspended in 180 ml of lysozyme buffer (20 mM Tris-HCl pH 8.0, 2 mM Na EDTA and 1.2% Triton X-100 with 40 mg ml−1 lysozyme added the day of use) and incubated at 37 °C, shaking for 30 min. Following lysis, 25 ml of proteinase K and 200 ml of buffer AL from the Qiagen kit were added to the lysate. After a 30-min incubation at 70 °C with shaking, 200 ml of 100% ethanol was added to the mixture. Contents were then added to a spin column and spun down at 20,000g for 1 min. Flowthrough was removed and 500 ml of buffer AW1 was added to the spin column. The column was spun once again at 20,000g for 1 min. Flowthrough was removed and 500 ml of buffer AW2 was added. The column was then centrifuged at 20,000g for 3 min to remove all buffer. The spin column was then moved to an Eppendorf tube and 200 ml of buffer AE added to the spin column. The mixture was incubated at room temperature for 1–5 min and then spun down to elute genomic DNA.
Measuring ncAA-dependent reporter gene expression in B. subtilis
To measure ncAA-dependent reporter gene expression, fresh colonies of engineered B. subtilis were picked from LB plates with antibiotics (10 μg ml−1 kanamycin and 5 μg ml−1 chloramphenicol) and inoculated into 1 ml of liquid LB medium in a 15-ml culture tube containing the same antibiotics. These cultures were grown at 25 °C to an OD600 of 0.2–0.4 in a roller drum and then subcultured depending on the reporter used. For the nanoluciferase reporter strains (strains bMJ252-254, and bMJ257-259), cultures were diluted to an OD of ~0.002 in LB with chloramphenicol, kanamycin and 100 μM OMY (Fisher Scientific M22761G). For the fluorescent reporter strains (strains bMJ024 and bMJ182), cultures were diluted to an OD of 0.02 in a minimal medium with 1/2× Murashige–Skoog basal salt mixture (PhytoTech Labs, M524), 1.5% sucrose (Sigma-Aldrich, S0389) and 10 mM L-glutamate (Acros Organics, 156211000) with OMY supplemented at the concentration specified. We leveraged leaky pHyperspank activity for constitutive expression without IPTG induction. Cultures were grown overnight in 300 μl in a 1.3-ml-deep well plate (Fisher Scientific, 12566611) at 1,000 rpm in a shaker with a 2.5-mm orbit (Thermo Scientific, 88882005) and incubated at 25 °C unless otherwise specified.
For fluorescent endpoint measurements, 100 μl of the cultures were diluted 1:1 with 100 μl of 1× PBS (Sigma-Aldrich, P4417) and then the absorbance (600 nm) and fluorescence (excitation: 485 nm, emission: 525) were read using a Biotek H1 Synergy spectrophotometric plate reader in a black-walled 96-well plate (Fisher Scientific, Greiner-Bio, 07-000-166). Endpoint measurements were also performed in a separate experiment using flow cytometry for Extended Data Fig. 6a with settings specified later.
For the nanoluciferase endpoint measurements, cultures were diluted 1:10 with 1× PBS and OD600 values were measured in a black-walled 96-well plate before adding the luciferin reagent. To measure nanoluciferase activity, the Nano-Glo luciferase reagent (Promega N2011) was diluted 1:400 in a 5% solution of the reagent buffer in 1× PBS. The diluted cultures were then mixed in a 1:1 ratio with assay substrate to a total volume of 50 μl in a half-area white-walled 96-well plate (Corning, 3885) and read over the course of 10 min on the Biotek H1 Synergy plate reader using an integration time of 1 s, full light emission, top optics, normal read speed with a 100-ms delay and extended dynamic range. The gain was set to 120 after being scaled automatically to the well with the highest luminescence value (the well containing the strain with the wild-type reporter).
For fluorescence measurements by flow cytometry, fluorescence was quantified using a NovoCyte flow cytometer. Samples were run with a flow rate of 14 μl min−1. B. subtilis cells were identified and counted by their clustering in the FSC–SSC space and then gated for singlets. Samples were run until 10,000 events were captured within these gates (Extended Data Fig. 4). Single-cell mNeongreen fluorescence levels were measured using a blue laser (488 nM) and the FITC-H filter. The arithmetic median of fluorescence distribution was calculated for each replicate.
Surfactin quantification
Strains were grown from LB agar plates to an OD600 of approximately 1.0 in 1/2× Murashige–Skoog medium supplemented with 1.5% sucrose and 10 mM glutamate containing antibiotics (final concentration of chloramphenicol: 5 µg ml−1). Strains were then inoculated into 300 µl of the same medium, supplemented with OMY as specified, at an initial OD600 of 0.01 in deep-well 96-well plates. Samples were grown for 24 h in an incubator at 37 °C and shaken at 1,000 rpm before centrifugation to pellet cells. Supernatant was collected for surfactin production quantification.
Surfactin was quantified using high-performance LC (HPLC) with an Agilent 1100 Infinity model with a Zorbax Eclipse Plus-C18 column with a guard column installed. To isolate surfactin peaks, an isocratic method of acetonitrile with 1% trifluoroacetic acid was used and samples were compared to a commercial standard (Smolecule, 24730-31-2). Briefly, 50 μL of sample was injected and run for 10 min and absorbance was analyzed at 205 nm. Quantification was accomplished by comparing peak areas of three major peaks in the commercial standard.
Growth kinetics of B. subtilis
PY79 expressing an orthogonal aaRS and tRNA (bDS176) was streaked out on LB agar plates with 10 μg ml−1 chloramphenicol from glycerol stocks. Single colonies were picked and grown in LB medium with 10 μg ml−1 chloramphenicol for about 4 h at 30 °C until they reached an OD600 of approximately 1.0. Cells were then inoculated at an OD600 of 0.01 into 1/2× Murashige–Skoog medium with 1.5% sucrose and 10 mM L-glutamate with varying concentrations of OMY and 10 μg ml−1 chloramphenicol. Growth was monitored using OD600 measurements on a Biotek Synergy H1 plate reader for 24 h with continuous shaking at 30 °C.
Flow cytometry of microorganisms extracted from soil
Soil (Espoma organic potting mix, 00050197701044) samples were prepared by weighing out 1 g of soil into glass culture tubes (18 × 150 mm) and autoclave-sterilizing for 20 min at 121 °C. Bacteria were grown by picking fresh colonies from LB agar into liquid LB medium, both containing antibiotics (chloramphenicol, final concentration: 5 µg ml−1; kanamycin, final concentration: 10 µg ml−1). These cultures were grown at 37 °C to an OD600 of 0.2–0.4 in a roller drum. Then, cells were washed six times in PBS before diluting to a final OD600 of 0.5 and adding 1 mM IPTG and 500 µM OMY. Next, 1 ml of cell suspension was mixed into each soil sample. Samples were incubated at 25 °C in the dark with a damp paper towel to prevent samples from drying out. After 1–3 days, cells were harvested by adding 5 ml of sterile PBS to the bacteria–soil mixture, vortexing and filtering through a 10-µm syringe filter. Fluorescence was quantified using a NovoCyte flow cytometer. Samples were run with a flow rate of 14 μl min−1. B. subtilis cells were identified and counted by their clustering in the FSC–SSC space; gates for singlets were drawn on PY79 and UD1022 samples grown in liquid LB and then applied to samples extracted from soil (Supplementary Data Fig. 2). Samples were run until 10,000 events were captured within these gates. Single-cell mNeongreen fluorescence levels were measured using a blue laser (488 nM) and the FITC-H filter. The arithmetic median of fluorescence distribution was calculated for each replicate.
Cocultivation of microorganisms and plants in soil
Soil was sieved through a mesh strainer and 0.5 g was weighed out into a 15-ml conical tube. Soil and tubes were autoclaved at 121 °C for 20 min. Presterilized Arabidopsis seeds were imbibed in 1.5 ml of sterile water and cold-stratified in the dark for 3 days at 4 °C. After stratification, seeds were sown into autoclaved soil and incubated at 22 °C in 60% relative humidity with a 16-h/8-h photoperiod for plants to germinate and grow. B. subtilis were prepared for cocultivation by harvesting exponential phase cultures grown in LB and washing six times in sterile water. After washing, cultures were diluted to an OD600 of 0.1 and mixed with 1 mM IPTG. Then, 500 μl of the cell solution was added to the soil containing 11-day-old seedlings. Plants and bacteria were cocultured for 3 days before samples were harvested for flow cytometry analysis as described above.
Plant growth conditions
N. benthamiana plants were grown and maintained in a Percival growth chamber (AR100L3) at 24 °C in 12-h light–dark cycles with 70% relative humidity. Light was provided by fluorescent white lights at a photon flux density of ~150–200 μmol m−2 s−1. Plants were grown in 4-inch pots with soil containing mycorrhizae, peat moss and perlite (PRO-MIX BX 10381RG).
A. thaliana plants were grown and maintained in a walk-in growth chamber (Percival AR-712L4) at 22/18 °C in 16-h/8-h light–dark cycles with 60% relative humidity for transformation and seed propagation. Light was provided by LED arrays at a photon flux density of ~145 μmol m−2 s−1. Plants were grown in 4-inch pots with soil containing mycorrhizae, peat moss and perlite (PRO-MIX BX 10381RG).
A. thaliana plants for imaging were grown and maintained in a separate growth chamber (Percival, CU36L4) at 22/18 °C in 16-h/8-h light–dark cycles. Light was provided by white fluorescent lights at a photon flux density of ~145 μmol m−2 s−1. Plants for imaging and root structure analysis were plated as seeds onto sterile Murashige–Skoog medium containing 0.6% Gelzan (Bioworld, 30634003), 1× Murashige–Skoog basal salt mixture (PhytoTech Labs, M524), 1% sucrose (Sigma, S0389) and 0.05% MES (Sigma-Aldrich, M8250), pH 5.7. Before plating, seeds were surface-sterilized with 70% ethanol for 5 min, followed by 20% bleach and 0.1% (v/v) Tween-20 (Sigma-Aldrich, P7949) for 5 min, and then washed three times with water for 2 min each. Seeds were cold-stratified for 3 days at 4 °C in the dark, either on the plate or in water before plating, before transfer to the growth chamber. Plates were sealed with micropore tape (3M, 1530-0) to allow for gas exchange.
Transient expression of constructs in N. benthamiana leaves
A. tumefaciens GV3101 cultures harboring the desired plasmids were inoculated from frozen glycerol stock (18% glycerol) into 14-ml culture tubes (VWR, 47729-566) containing 2 ml of LB medium with antibiotics. Cultures were grown for 24 h at 28 °C and 250 rpm. The next day, cultures were backdiluted to an OD600 of 0.02 in fresh LB medium with antibiotics and grown for another 24 h at 28 °C and 250 rpm. Cells were then collected by centrifugation (8 min, 3,000g), resuspended in 1 ml of infiltration buffer (10 mM MgCl2 (Sigma, M8266), 10 mM MES pH 5.7 (Sigma, M8250) and 150 μM acetosyringone (Cayman, 23224)) and incubated at room temperature for 3 h. Agrobacterium strains were then mixed to generate samples for leaf infiltration. The strain containing the sfGFP–MfnG construct was added to the mixture at an OD600 of 0.3 and a strain containing the p19 suppressor of silencing was added at an OD600 of 0.2. Final sample volumes were adjusted to 1 ml using infiltration buffer. Samples were infiltrated into the abaxial side of the N. benthamiana leaves using a 1-ml needleless syringe (Fisher Scientific, 22-253-260). Infiltrated plants were returned to normal growth conditions for ~72 h. Leaf discs were then harvested from infiltrated and uninfiltrated areas of the leaf using the back of a pipette tip (P20; Rainin, 17005873) for metabolite extraction and LC–MS analysis.
Generation of Arabidopsis transgenic lines
Heritable transgenic lines of Arabidopsis were generated by A. tumefaciens-mediated floral dip of A. thaliana Col-0 ecotype83. Briefly, A. tumefaciens cultures were inoculated from frozen glycerol stock (18% glycerol) into 14-ml culture tubes containing 2 ml of LB medium with antibiotics. Cultures were grown for 24 h at 28 °C and 250 rpm. After incubation, 250 μl of bacterial culture was plated on 15-cm round LB agar plates containing antibiotics and incubated for two nights at 28 °C. Next, the cells were scraped from plates and resuspended in 200 ml of transformation buffer (50 g L−1 sucrose and 250 μl L−1 Silwet L-77 (Bioworld, 30630216)). Arabidopsis inflorescences were briefly submerged in the bacterial solution and then transferred to a dark, humid container where they were allowed to incubate overnight. The following day, transformed plants were returned to normal growth conditions where they continued to grow until they produced seeds. Transgenic seeds were screened using fluorescence microscopy. All constructs used for Arabidopsis transformation contain FastRed, a seed-specific TagRFP marker, which enables selection of T1 transgenic plants by screening for red fluorescence in dry seeds84. For each construct, we screened multiple independent T1 events and selected one or more representative lines, denoted by event number, for further characterization.
Generation of OMY-producing tomato hairy roots
Tomato seeds (S. lycopersicum cv. Heinz 1706) were surface-sterilized by briefly soaking (<1 min) in 70% (v/v) ethanol, followed by incubation for 15 min in a sterilization solution containing 2.5% (v/v) sodium hypochlorite (prepared by diluting 3 ml of 8.25% commercial bleach in 10 ml of distilled water) and 0.05% (v/v) Tween-20. Seeds were then washed five times with sterile distilled water and drained thoroughly. Sterilized seeds were soaked overnight in sterile distilled water at room temperature and subsequently placed on sterile Murashige–Skoog medium plates containing 0.6% Gelzan, 0.5× Murashige–Skoog basal salt mixture and 0.05% MES at pH 5.7. Seedlings were grown in a growth chamber (Percival, CU36L4) in standard conditions (22/18 °C, 16-h/8-h light–dark cycles) with a photon flux density of approximately 145 μmol m−2 s−1 for 8 days. The radicle and lower hypocotyl of 8-day-old seedlings were excised, retaining the apical 4 cm of the hypocotyl. The freshly cut wound surface was inoculated by coating with transgenic R. rhizogenes strain K599 harboring the construct of interest. The bacteria were precultured on YEB plates supplemented with 100 µg ml−1 kanamycin and 200 µM acetosyringone and then applied to the wound surface using a sterile pipette tip. Inoculated seedlings were transferred to fresh Murashige–Skoog gelzan plates and cocultivated for 3 days under the same growth chamber conditions. After cocultivation, seedlings were transferred to Murashige–Skoog gelzan plates supplemented with 400 mg L−1 timentin (Goldbio, T-104) to eliminate R. rhizogenes. Seedlings were subcultured onto fresh timentin-containing Murashige–Skoog plates every 14 days. Adventitious roots emerging initially from the wound site are not transgenic; transgenic hairy roots were first observed approximately 2 weeks after inoculation. Plants were maintained for 6 weeks after inoculation to allow sufficient transgenic root biomass to accumulate before use in downstream luminescence assays.
Generation of OMY-producing poplar hairy roots
P. tremula × alba (clone INRA 717-1B4) plants were grown under aseptic conditions in Murashige–Skoog agar medium (0.5× Murashige–Skoog basal medium with vitamins (PhytoTech Labs, M519), 4 g L−1 sucrose, 7 g L−1 phytoagar (Bioworld, 40100072) and 0.05% MES, pH 5.8) in a growth chamber (Percival, CU36L4) under standard conditions (22/18 °C, 16-h/8-h light–dark cycles with a photon flux density of approximately 145 μmol m−2 s‒1). Apical explants were prepared for transformation by excising plant segments with two to three leaves using a sterile scalpel. The freshly cut wound surface was inoculated by dragging it across a lawn of transgenic R. rhizogenes strain K599 harboring the construct of interest. The bacteria were precultured in 5 ml of liquid LB medium supplemented with appropriate selection antibiotics at 28 °C for 24 h and then plated onto solid LB medium containing antibiotics and 200 μM acetosyringone. Plates were incubated at 28 °C for 48 h to establish a bacterial lawn for inoculation. Inoculated explants were immediately inserted into antibiotic-free Murashige–Skoog medium and cocultivated for 3 days under the same growth chamber conditions as before. Following cocultivation, explants were transferred to fresh Murashige–Skoog medium supplemented with 200 mg L−1 timentin and 200 mg L−1 carbenicillin to eliminate R. rhizogenes. Transgenic hairy roots were first observed approximately 4 weeks after inoculation. At 5 weeks after inoculation, transformed plants were excised from the selective medium for cocultivation with B. subtilis luciferase reporter strains for luminescence assays.
Fluorescence imaging of Arabidopsis transgenic lines
Fluorescence images of Arabidopsis lines expressing sfGFP–MfnG constructs were collected using a Leica THUNDER widefield fluorescence microscope (M205 FCA) with the ET GFP filter (Leica, 10447408; excitation: 470/40, emission: 525/50) at 150 ms or 500 ms of exposure as noted. All image processing was performed using the Fiji software. Processing steps included setting thresholds for minimum and maximum brightness, applying LUTs (Green for green fluorescence, Fire for luminescence), generating color bars and merging channels.
Root exudate collection and metabolite extraction
Root exudate from wild-type Col-0 and transgenic MfnG-expressing Arabidopsis was collected in Murashige–Skoog medium for metabolite quantification by LC–MS. Seeds were sown on sterile Murashige–Skoog plates (0.5× Murashige–Skoog basal salts, 1% sucrose and 0.6% Gelzan, pH 5.7), stratified for 3 days in the dark at 4 °C, then moved to the growth chamber (Percival, CU36L4) and grown under standard conditions (22/18 °C, 16-h/8-h light/dark cycles). After 6 days, seedlings were transferred to 3′ × 3′ × 4′ Magenta boxes (Bioworld, 30930007 GA-7) for hydroponic growth in 12 ml of sterile liquid medium (0.5× Murashige–Skoog basal salts and 1% sucrose, pH 5.7). Magenta boxes were sealed with micropore tape and incubated for 48 h under standard Arabidopsis growth conditions on an orbital shaker at 50 rpm. After 48 h, 10 ml of medium was collected from each box with a serological pipette, syringe-filtered through a 0.45-µm filter and transferred to 15-ml centrifuge tubes. To prepare samples for lyophilization, tubes were frozen at −80 °C for 30 min and then moved to dry ice. Tube caps were replaced by Kimwipes secured over the opening with rubber bands for lyophilization in a Labconco lyophilizer (Labconco, 710612010) for 24 h. Samples were stored at −80 °C after lyophilization until metabolite extraction. To extract metabolites, 500 µl of 80% methanol (v/v) was added to each sample, briefly vortexed, sonicated (Branson, 2800) for 15 min on the high setting and centrifuged for 10 min (Thermo Scientific Sorvall X4R Pro TX1000 rotor) at 3,700g. For each sample, 400 µl of supernatant was sampled for LC–MS analysis.
LC–MS analysis to quantify OMY production
LC–MS samples were analyzed on an Agilent 1260 HPLC system coupled to an Agilent 6520 Q-TOF MS instrument. Separation was performed using a Gemini 5-μm NX-C18 110-Å column (2 × 100 mm; Phenomenex) with a mixture of 0.1% formic acid in water (A) and 0.1% formic acid in acetonitrile (B) at a constant flow rate of 400 μl per min at room temperature. The injection volume was 3 μl for experimental samples and 1 μl for metabolite standards. The following gradient of solvent B was used: 1% 0–1 min, 1–8% 1–3 min, 8–97% 3–15 min, 97–1% 15–16 min, 1% 16–22 min. MS data were collected using electrospray ionization in positive mode with a mass range of 50–1,200 m/z and a rate of one spectrum per second. The ionization source was set as follows: 325 °C gas temperature, 10 L min−1 drying gas, 35 psi nebulizer, 3,500 V VCap, 150 V fragmentor, 65 V skimmer and 750 V octupole 1 RF Vpp.
Data were collected with Agilent MassHunter Workstation Data Acquisition and analyzed by MassHunter Qualitative Analysis (version 10.0). Extracted ion chromatograms (EICs) were extracted for [M + H]+ ions using 196.067 m/z for OMY and 182.0800 m/z for tyrosine, with an error of 20 ppm. Counts per minute data were exported to CSV files for further data analysis and visualization. For conversion of integrated peak values to OMY concentration, an OMY calibration curve was run at the same time as the samples with concentrations 0.5 µM, 1 µM, 2 µM, 5 µM, 25 µM and 100 µM with two technical replicates per concentration. OMY stock for LC–MS was prepared at 10 mM with MilliQ water without adjusting pH.
Root phenotyping
For analysis of root length, lateral root density and gravitropism, Arabidopsis seeds were germinated and grown on Murashige–Skoog medium containing 0.6% Gelzan (Bioworld 30634003), 1× Murashige–Skoog basal salt mixture (PhytoTech Labs, M524), 1% sucrose (Sigma, S0389) and 0.05% MES (Sigma-Aldrich, M8250), pH 5.7. For exogenous treatment of seedlings with OMY, appropriate volumes of filter-sterilized 500 mM stock solution of OMY (Chem-Impex, 06251) were mixed into the Murashige–Skoog gelzan medium before gelling. OMY stock solution was prepared in MilliQ water with 10 M KOH added until all OMY was dissolved (final pH: ~11). For exogenous treatment of seedlings with standard amino acids, filter-sterilized L-tyrosine (1 mM in MilliQ, pH adjusted to 9.7 with 10 M KOH, overnight stirring; Research Products International, T68500) and L-phenylalanine (11 mM in MilliQ; Research Products International, P20260) stocks were added to Murashige–Skoog gelzan medium before gelling. Seeds were sown and germinated directly on OMY and amino acid treatment plates. After growth, plates were imaged using a dual-light flatbed scanner (Epson V800, 800 dpi) at different time points after stratification, as described in the figure captions. Total root length was quantified using the Fiji SmartRoot tool85 and measured from the hypocotyl–root junction to the root tip. Plants that did not germinate were discounted from the analysis. The number of emerged lateral roots was counted from the scanned images. Lateral root density calculated as the number of emerged lateral roots divided by primary root length. Gravitropism score is calculated as the vector length of the root on the plate divided by primary root length.
Cocultivation of plants and bacteria on plates for luciferase imaging of OMY incorporation
To create the bacteria–agar matrix for cocultivation of plants and bacteria, B. subtilis strains were streaked from frozen glycerol stocks onto LB agar plates with appropriate antibiotics and incubated at 37 °C overnight. Colonies were inoculated into 50 ml of LB without antibiotics in 200-ml flasks and incubated at 37 °C with 250 rpm shaking. After cultures reached an OD600 of ~1 (3–4 h), they were decanted into 50-ml centrifuge tubes (Corning, 352070) and washed three times with 25 ml of sterile 1× PBS (Sigma-Aldrich, P4417-100TAB), each time pelleting at 3,700g for 10 min (Thermo Scientific Sorvall X4R Pro TX1000 rotor). The final pellet was resuspended in 1 ml of 1× PBS. Murashige–Skoog agar medium (0.5× Murashige–Skoog basal salts, 1% sucrose, 1% agar and 0.05% MES, pH 5.7) was prepared, autoclaved and allowed to cool to ~55 °C. Bacteria were then mixed into the medium at a final OD600 of 0.1. When appropriate, β-estradiol was mixed into the Murashige–Skoog agar at this stage (1:1,000 v/v) to a final concentration of 20 μM. After mixing, the bacteria–agar mixture was immediately pipetted into sterile petri dishes. For Arabidopsis seedlings, 30 ml of mixture was added to 100-mm square plates (Genesee, 26-275); for tomato composite hairy roots, 50 ml was added to 120-mm square plates (Greiner-Bio-One, 688161); for poplar composite hairy roots, 250 ml was added to 245-mm square plates (Corning, 431111).
Once the bacteria–agar matrix cooled, plants were transferred onto the plates for cocultivation using sterile forceps. Plant roots were placed directly onto the surface of the solidified bacteria–agar matrix, allowing root–bacteria contact to occur at the agar surface. Arabidopsis plants or composite plants were placed onto each plate, which were then sealed with micropore tape, wrapped in foil from the bottom up to the top of the shoot and returned to the growth chamber for cocultivation in standard conditions. A schematic of the cocultivation setup is provided in Supplementary Fig. 1.
After 4 days of cocultivation (5 days for poplar), luciferin was applied to the plate as an agarose film. This luciferin–agarose mixture is overlaid on top of the cocultivated roots and bacteria to deliver the luciferase substrate for imaging. To create this film, 0.8% agarose (Research Products International, A20090) was dissolved in water and cooled to ~55 °C. NanoFuel (NanoLight Technology, 324-50; Arabidopsis assays) or Nano-Glo (Promega, N1110; tomato and poplar assays) substrates were diluted 1:25 into their respective buffers and then added to the molten agarose solution for a final dilution of 1:500. Luciferin–agarose mixtures were immediately applied to cocultivation plates by slowly pipetting a thin surface layer over plants roots and bacteria (10 ml for Arabidopsis assays, 15 ml for tomato and 60 ml for poplar). Cocultivation plates were immediately imaged with an iBright Imaging System (Invitrogen, FL1500) with the following settings: brightfield (membrane channel, autoexposure), luminescence (ChemiBlot channel, 30 s of exposure unless otherwise indicated), fluorescence (RFP, excitation: 515–545 nm, emission: 568–617 nm, 15 ms of exposure; GFP, excitation: 455–485 nm, emission: 508–557 nm, 15 ms of exposure). All image processing was performed using Fiji software. Processing steps included setting thresholds for maximum brightness, applying LUTs (Green for green fluorescence, Fire for luminescence), generating color bars and merging channels.
For β-estradiol induction, 20 mM β-estradiol was mixed into the Murashige–Skoog gelzan–bacteria medium before gelling at 1:1,000 v/v. β-Estradiol (Sigma-Aldrich, E2758) stock solution was prepared in DMSO (Sigma-Aldrich, 34869).
Quantification and analysis of luminescence intensity
Raw luminescence (ChemiBlot channel) images (16-bit) were used for quantification with Fiji. Square regions of interest (ROIs) were drawn on the corresponding brightfield image (membrane channel) following grid borders on the petri dish. ROIs were propagated to the luminescence image and the ‘plot profile’ tool was used to plot the vertically averaged pixel intensity at distances along the x axis, starting with 0 cm at the left extreme.
Further data analysis was implemented in Python 3 using numpy, scipy (version 1.11) and pandas. Local maxima (peaks) in the luminescence intensity profile corresponding to the location of individual seedlings were extracted as follows. Each profile was smoothed with a uniform (boxcar) moving-average filter (kernel width = 1/10 of the expected interpeak spacing) to reduce noise. Candidate peaks were identified using scipy.signal.find_peaks with a minimum interpeak distance set to half the expected spacing. The prominence threshold parameter was iteratively lowered from 30% to 1% of the intensity value range until at least n (the number of seedlings) peaks were found. Only the n most prominent peaks were retained. If fewer than n peaks were detected, the largest interpeak gap was bisected and the local maximum within that gap was added. Each detected peak was then snapped to the local maximum of the unsmoothed profile within ±3 data points (~0.08 cm). For PY79 negative control plates, as no peaks were expected, peak positions were assigned to fixed equidistant intervals along the x axis.
For each peak at position x0, two midpoints were defined: x1 halfway between x0 and the adjacent peak to the left (or the profile start) and x2 halfway to the adjacent peak to the right (or the profile end). The peak (maximum) intensity y was taken as the exact (unsmoothed) value at x0. The baseline intensities y1 and y2 were computed as the mean value within ±0.1 cm of x1 and x2, respectively, and averaged to yield the base intensity y0 = (y1 + y2)/2. The normalized luminescence ratio (fold change) was calculated as y/y0. Peak and midpoint locations are annotated in Supplementary Fig. 3. Claude Science Opus 4.6 was used in the development of the Python analysis script.
Proteomics
All surfaces and equipment were cleaned with ethanol to prevent keratin contamination. Methanol was avoided to prevent artificial methylation.
Protein extraction
Arabidopsis seedlings were grown on 1× Murashige–Skoog gelzan plates and harvested at 14 days. Shoot and root tissue was separated with a razor blade and placed into separate 2-ml Safe-Lock tubes (Eppendorf, 022363344) with forceps. Samples were immediately weighed, flash-frozen in liquid nitrogen and then stored at −80 °C until extraction. Sample collection data are provided in Supplementary Table 4. To homogenize tissue, one metal bead was added to each tube and samples were lysed for 2 min at 30 Hz (RETSCH MM 400 Mixer Mill). Next, 2× SDS sample loading buffer (125 mM Tris-HCl pH 6.8 (VWR, 97061-796), 4% SDS (Sigma, 1125330250), 20% glycerol (Sigma, G5516) and 5% v/v β-mercaptoethanol (Sigma, M3148)) was added to tissues at 3:1 v/w. Samples were then boiled for 5 min at 95 °C (Thermolyne DB28125 Dri-Bath, Marshall Scientific). After cooling, samples were spun down in a benchtop centrifuge at 16,000g for 20 min and supernatants were extracted into new tubes for gel purification.
Gel electrophoresis and staining/destaining
First, 50 µl of each supernatant was loaded into the well of a polyacrylamide gel (Bio-Rad, 4561094). A buffer lane was left between each sample to prevent cross-contamination. Samples were run in 1× Tris–glycine–SDS buffer (Bio-Rad, 1610732) at 100 V until 5–10 mm into the resolving gel. The gel was then stained for 6 h in a methanol-free staining buffer to prevent artificial methylation. Next, 50 ml of buffer was prepared with the following in double-distilled H2O: 10.5 g of citric acid monohydrate (final concentration: 1 M; Millipore Sigma, C1909), 2.5 ml of glacial acetic acid (final concentration: 5%; Fisher Chemicals, AA36289AP) and 5 ml of stainer B and 10 ml of stainer A from the Invitrogen colloidal blue staining kit (Thermo Fisher Scientific, LC6025). Gels were destained with HPLC-grade water overnight.
Protein in-gel digestion and peptide purification
Following destaining, whole protein bands were excised from the gel using a scalpel inside a laminar flow hood, limited to a maximum length of 10 mm. Excised bands were diced into small 1-mm2 pieces in the presence of a droplet of MS-grade water to facilitate cutting and the pieces were transferred into 0.65 ml of low-retention microcentrifuge tubes (Fisher Scientific, 13698793). The gel pieces were destained by three wash cycles with 400 µl of buffer B1 (25 mM ammonium bicarbonate (Millipore Sigma A6141) in 50% acetonitrile (v/v; Fisher Chemicals, A998SK-4), vortexing for 10 min and removing the supernatant. This was followed by one 5-min wash cycle with buffer A1 (25 mM ammonium bicarbonate in double-distilled H2O) and one 15-min wash cycle with buffer B1, until the blue dye largely disappeared from the gel pieces.
For reduction and alkylation, disulfide bonds were reduced by incubating the gel pieces in 100 µl of 10 mM dithiothreitol (Millipore Sigma, D0632) (prepared from 500 mM stock in 25 mM ammonium bicarbonate) at 56 °C for 1 h. After cooling to room temperature, 100 µl of 50 mM iodoacetamide (Millipore Sigma, I1149; prepared from 500 mM stock in 25 mM ammonium bicarbonate) was added and alkylation was allowed to proceed in the dark for 45 min at room temperature. The reagents were removed and the gel pieces were washed three times with 200 µl of buffer B1 with 10-min vortexing steps. Gel pieces were then evacuated to complete dryness with a SpeedVac system (SpeedVac concentrator, Thermo Scientific Savant SPD121P; refrigerated vapor trap, Thermo Scientific Savant RUT5105; vacuum pump, Thermo Scientific OFP400).
The dried gel pieces were rehydrated and digested by adding 10–50 µl of trypsin to just barely cover the gel pieces. Trypsin (Thermo Fisher Scientific, 20233) was freshly diluted to 5 ng µl−1 in buffer A1 before use. Following a 5-min incubation with trypsin, additional buffer A1 was added as needed to ensure that the gel pieces remained entirely submerged in solution. Digestion was allowed to proceed overnight at 37 °C.
Peptides were extracted by adding 100 µl of buffer B2 (50% acetonitrile and 0.1% formic acid (v/v; Fisher Chemicals, A117-50) in HPLC-grade water). The samples were vortexed for 15 min and the peptide-rich supernatant was carefully transferred to fresh low-retention tubes while avoiding gel carryover. This extraction step was performed three times in total. The combined supernatants were centrifuged at 20,000g (Eppendorf, 5417C) for 15 min to pellet any debris and ~400 µl of supernatant was transferred into fresh tubes. The sample tubes were flash-frozen in liquid nitrogen for 2 min with lids open and then placed into a SpeedVac to dry completely (about 2 h).
Peptides were then desalted with ZipTip OMIX C18 tips (Agilent, A57003100). The dry peptide residues were reconstituted in 20 µl of buffer A2 (0.1% formic acid v/v in HPLC-grade water) and centrifuged at 20,000g for 15 min. Next, 20 µl of supernatant was transferred to a fresh tube. The C18 matrix was activated by aspirating and discarding 20 µl of buffer B2 and then equilibrated by aspirating and discarding 20 µl of buffer A2 four times. The reconstituted peptide sample was bound to the resin through eight aspirate–dispense cycles. The matrix was then washed with buffer A2 eight times to remove salts. The purified peptides were eluted directly into fresh low-retention tubes by aspirating and dispensing buffer B2 eight times. Continuous wetting of the ZipTip was maintained during the operation to prevent collapse of the matrix. The eluted samples were dried completely in a SpeedVac (about 30 min) and stored at −80 °C before MS analysis.
LC–MS/MS analysis
LC–MS/MS was carried out on an Orbitrap Eclipse MS instrument (Thermo Fisher), equipped with an Easy LC 1200 UPLC system (Thermo Fisher). Peptides were first trapped using a trapping column (Acclaim PepMap 100 C18 HPLC, 75-μm particle size, 2-cm bed length) and then separated using an AUR3-25075C18, 25CM Aurora series C18 emitter column (25 cm × 75 µm, 1.7 µm; IonOpticks). The flow rate was 300 nl min−1. Peptides were eluted by a gradient from 3% to 28% solvent B (80% acetonitrile and 0.1 % formic acid) over 106 min and from 28% to 44% solvent B over 15 min, followed by a short wash (15 min) at 90% solvent B.
For data acquisition, precursor scan was set to m/z 375–1,600 (resolution: 120,000; automatic gain control (AGC): 200,000, maximum injection time: 50 ms, normalized AGC target: 50%, RF lens: 30%) and the most intense multiply charged precursors were selected for fragmentation (resolution: 15,000, AGC: 5 × 10⁴, maximum injection time: 22 ms, isolation window: 1.4 m/z, normalized AGC target: 100%, charge state: 2–8, cycle time: 3 s). Peptides were fragmented with higher-energy collision dissociation with a normalized collision energy of 27. Dynamic exclusion was enabled for 30 s.
Data search with MSFragger and Perseus
MS/MS spectra were searched separately against the Araport11 database A. thaliana (https://www.arabidopsis.org/), concatenated with decoy protein sequences using the MSFragger 4.1 software by including O-methylation at tyrosine (delta mass of +14.01565) as a variable modification with default criteria to obtain label-free quantification intensities. The search results were analyzed separately in Perseus (version 2.0.10.0). Processing was conducted in Perseus. First, MSFragger intensities were log2-transformed. Only proteins that had at least three valid values in at least one group (wild type or proUBQ10::sfGFP-MfnG) were kept. The remaining missing MaxLFQ intensities were then imputed from a normal distribution that was downshifted by 1.8 and a width of 0.3 column-wise. A two-sample t-test was conducted with permutation-based (n = 250) false discovery rate (FDR) = 0.05 and S0 = 1.5.
Graphing and statistical analysis
Graphs were constructed using GraphPad Prism and Python packages. Flow cytometry histograms were constructed in the NovoExpress software. Mann–Whitney and Kruskal–Wallis (two-tailed, no multiple comparison correction) significance tests were computed in Prism. Relative IC50 curves were fitted in Prism from median values.
Reporting summary
Further information on research design is available in the Nature Portfolio Reporting Summary linked to this article.
Data availability
All plasmid materials and bacterial strains will be made available through Addgene or the Bacillus Genetic Stock Center. Sequence files, processed and unprocessed images and raw data are available in the Supplementary Information. A supplementary image set is hosted on Zenodo (https://doi.org/10.5281/zenodo.21708042)86. The proteomics dataset is hosted on PRIDE under dataset identifier PXD084218 (ref. 87). Source data are provided with this paper.
References
-
Good, A. G. & Beatty, P. H. Fertilizing nature: a tragedy of excess in the commons. PLoS Biol. 9, e1001124 (2011).
-
Baweja, P., Kumar, S. & Kumar, G. Fertilizers and pesticides: their impact on soil health and environment. in Soil Health Soil Biology vol. 59 (eds Giri, B. & Varma, A.) 265–285 https://doi.org/10.1007/978-3-030-44364-1_15 (Springer, 2020).
-
Kozaeva, E. et al. Roots of synthetic ecology: microbes that foster plant resilience in the changing climate. Curr. Opin. Biotechnol. 88, 103172 (2024).
-
Clauer, P. et al. Synthetic biology of plants and microbes for agriculture, environment, and future applications. Chem. Rev. 126, 895–1109 (2026).
-
Buss, W. et al. Hurdles to overcome to achieve biostimulant-driven, low chemical input crop production. Plants People Planet 8, 783–791 (2026).
-
Ruzzi, M., Colla, G. & Rouphael, Y. Editorial: Biostimulants in agriculture II: towards a sustainable future. Front. Plant Sci. 15, 1427283 (2024).
-
Russ, D., Fitzpatrick, C. R., Teixeira, P. J. P. L. & Dangl, J. L. Deep discovery informs difficult deployment in plant microbiome science. Cell 186, 4496–4513 (2023).
-
Maron, J. L. & Connors, P. G. A native nitrogen-fixing shrub facilitates weed invasion. Oecologia 105, 302–312 (1996).
-
Moore, J. A. M., Abraham, P. E., Michener, J. K., Muchero, W. & Cregger, M. A. Ecosystem consequences of introducing plant growth promoting rhizobacteria to managed systems and potential legacy effects. New Phytol. 234, 1914–1918 (2022).
-
Geddes, B. A. et al. Engineering transkingdom signalling in plants to control gene expression in rhizosphere bacteria. Nat. Commun. 10, 3430 (2019).
-
Haskett, T. L. et al. Engineered plant control of associative nitrogen fixation. Proc. Natl Acad. Sci. USA 119, e2117465119 (2022).
-
Oger, P., Petit, A. & Dessaux, Y. Genetically engineered plants producing opines alter their biological environment. Nat. Biotechnol. 15, 369–372 (1997).
-
Dundas, C. M. et al. Rhizobacterial biosensors spatially map natural and engineered sucrose exudation. Preprint at bioRxiv https://doi.org/10.64898/2026.04.15.718812 (2026).
-
Fray, R. G. et al. Plants genetically modified to produce N-acylhomoserine lactones communicate with bacteria. Nat. Biotechnol. 17, 1017–1020 (1999).
-
Wang, Y. et al. Sentinel plants enable aboveground detection of belowground soil microbial activity. Preprint at bioRxiv https://doi.org/10.64898/2026.03.23.713735 (2026).
-
Seigler, D. S. Nonprotein amino acids. in Plant Secondary Metabolism 215–233 https://doi.org/10.1007/978-1-4615-4913-0_13 (Springer, 1998).
-
Bell, E. A. The non-protein amino acids of higher plants. Endeavour 4, 102–107 (1980).
-
Fowden, L. Non-protein amino acids of plants. Food Chem. 6, 201–211 (1981).
-
Bell, E. A. Nonprotein amino acids of plants: significance in medicine, nutrition, and agriculture. J. Agric. Food Chem. 51, 2854–2865 (2003).
-
Jander, G., Kolukisaoglu, U., Stahl, M. & Yoon, G. M. Physiological aspects of non-proteinogenic amino acids in plants. Front. Plant Sci. 11, 519464 (2020).
-
Wang, L., Xie, J. & Schultz, P. G. Expanding the genetic code. Annu. Rev. Biophys. 35, 225–249 (2006).
-
Dumas, A., Lercher, L., Spicer, C. D. & Davis, B. G. Designing logical codon reassignment—expanding the chemistry in biology. Chem. Sci. 6, 50–69 (2015).
-
Liu, J. et al. Biosynthesis of the anti-infective marformycins featuring pre-NRPS assembly line N-formylation and O-methylation and post-assembly line C-hydroxylation chemistries. Org. Lett. 17, 1509–1512 (2015).
-
Wang, C. et al. Diversely functionalised cytochalasins through mutasynthesis and semi-synthesis. Chemistry 26, 13578–13583 (2020).
-
Forti, A. M., Jones, M. A., Elbeyli, D. N., Butler, N. D. & Kunjapur, A. M. Engineered orthogonal and obligate bacterial commensalism mediated by a non-standard amino acid. Nat. Microbiol. 10, 1404–1416 (2025).
-
Wang, L., Brock, A., Herberich, B. & Schultz, P. G. Expanding the genetic code of Escherichia coli. Science 292, 498–500 (2001).
-
Stork, D. A. et al. Designing efficient genetic code expansion in Bacillus subtilis to gain biological insights. Nat. Commun. 12, 5429 (2021).
-
Tian, R. et al. Titrating bacterial growth and chemical biosynthesis for efficient N-acetylglucosamine and N-acetylneuraminic acid bioproduction. Nat. Commun. 11, 5078 (2020).
-
Zer, H. et al. The phytotoxicity of meta-tyrosine is associated with altered phenylalanine metabolism and misincorporation of this non-proteinogenic phe-analog to the plant’s proteome. Front. Plant Sci. 11, 140 (2020).
-
Kurepa, J., Toh-e, A. & Smalle, J. A. 26S proteasome regulatory particle mutants have increased oxidative stress tolerance. Plant J. 53, 102–114 (2008).
-
Klipcan, L., Moor, N., Kessler, N. & Safro, M. G. Eukaryotic cytosolic and mitochondrial phenylalanyl-tRNA synthetases catalyze the charging of tRNA with the meta-tyrosine. Proc. Natl Acad. Sci. USA 106, 11045–11048 (2009).
-
Youngman, P. J., Perkins, J. B. & Losick, R. Genetic transposition and insertional mutagenesis in Bacillus subtilis with Streptococcus faecalis transposon Tn917. Proc. Natl Acad. Sci. USA 80, 2305–2309 (1983).
-
Hall, M. P. et al. Engineered luciferase reporter from a deep sea shrimp utilizing a novel imidazopyrazinone substrate. ACS Chem. Biol. 7, 1848–1857 (2012).
-
Kim, H.-S. et al. Expression of sfp gene and hydrocarbon degradation by Bacillus subtilis. Biotechnol. Lett. 22, 1431–1436 (2000).
-
Grefen, C. et al. A ubiquitin-10 promoter-based vector set for fluorescent protein tagging facilitates temporal stability and native protein distribution in transient and stable expression studies. Plant J. 64, 355–365 (2010).
-
McLaughlin, S., Zhalnina, K., Kosina, S., Northen, T. R. & Sasse, J. The core metabolome and root exudation dynamics of three phylogenetically distinct plant species. Nat. Commun. 14, 1649 (2023).
-
Huang, T., Tohge, T., Lytovchenko, A., Fernie, A. R. & Jander, G. Pleiotropic physiological consequences of feedback-insensitive phenylalanine biosynthesis in Arabidopsis thaliana. Plant J. 63, 823–835 (2010).
-
Kamiya, M. et al. Control of root cap maturation and cell detachment by BEARSKIN transcription factors in Arabidopsis. Development 143, 4063–4072 (2016).
-
Zuo, J., Niu, Q.-W. & Chua, N.-H. An estrogen receptor-based transactivator XVE mediates highly inducible gene expression in transgenic plants. Plant J. 24, 265–273 (2000).
-
Cartwright, D. A., Brady, S. M., Orlando, D. A., Sturmfels, B. & Benfey, P. N. Reconstructing spatiotemporal gene expression data from partial observations. Bioinformatics 25, 2581–2587 (2009).
-
Bishnoi, U., Polson, S. W., Sherrier, D. J. & Bais, H. P. Draft genome sequence of a natural root isolate, Bacillus subtilis UD1022, a potential plant growth-promoting biocontrol agent. Genome Announc. 3, e00696-15 (2015).
-
Sato, S. et al. The tomato genome sequence provides insights into fleshy fruit evolution. Nature 485, 635–641 (2012).
-
Zhou, R. et al. Haplotype-resolved genome assembly of Populus tremula × P. alba reveals aspen-specific megabase satellite DNA. Plant J. 116, 1003–1017 (2023).
-
Ozyigit, I. I., Dogan, I. & Artam Tarhan, E. Agrobacterium rhizogenes-mediated transformation and its biotechnological applications in crops. in Crop Improvement (eds Hakeem, K. R., Ahmad, P. & Ozturk, M.) 1–48 https://doi.org/10.1007/978-1-4614-7028-1_1 (Springer, 2013).
-
Boisson-Dernier, A. et al. Agrobacterium rhizogenes-transformed roots of Medicago truncatula for the study of nitrogen-fixing and endomycorrhizal symbiotic associations. Mol. Plant Microbe Interact. 14, 695–700 (2001).
-
Su, Y.-H., Frommer, W. B. & Ludewig, U. Molecular and functional characterization of a family of amino acid transporters from Arabidopsis. Plant Physiol. 136, 3104–3113 (2004).
-
Fukaki, H., Tameda, S., Masuda, H. & Tasaka, M. Lateral root formation is blocked by a gain-of-function mutation in the SOLITARY-ROOT/IAA14 gene of Arabidopsis. Plant J. 29, 153–168 (2002).
-
Ariizumi, T. et al. Lifting DELLA repression of Arabidopsis seed germination by nonproteolytic gibberellin signaling. Plant Physiol. 162, 2125–2139 (2013).
-
Furuhata, Y., Rix, G., Van Deventer, J. A. & Liu, C. C. Directed evolution of aminoacyl-tRNA synthetases through in vivo hypermutation. Nat. Commun. 16, 4832 (2025).
-
Chemla, Y., Ozer, E., Algov, I. & Alfonta, L. Context effects of genetic code expansion by stop codon suppression. Curr. Opin. Chem. Biol. 46, 146–155 (2018).
-
Lajoie, M. J. et al. Genomically recoded organisms expand biological functions. Science 342, 357–360 (2013).
-
Meyerovich, M., Mamou, G. & Ben-Yehuda, S. Visualizing high error levels during gene expression in living bacterial cells. Proc. Natl Acad. Sci. USA 107, 11543–11548 (2010).
-
Romero Romero, M. L. et al. Environment modulates protein heterogeneity through transcriptional and translational stop codon readthrough. Nat. Commun. 15, 4446 (2024).
-
Luo, X. et al. Genetically encoding phosphotyrosine and its nonhydrolyzable analog in bacteria. Nat. Chem. Biol. 13, 845–849 (2017).
-
Iype, T. et al. Hijacking a bacterial ABC transporter for genetic code expansion. Nature 647, 1045–1053 (2025).
-
Chiu, C.-Y., Wang, M. K., Hwong, J.-L. & King, H. B. Physical and chemical properties in rhizosphere and bulk soils of Tsuga and Yushania in a temperate rain forest. Commun. Soil Sci. Plant Anal. 33, 1723–1735 (2002).
-
Chaudhary, D. R., Saxena, J., Lorenz, N. & Dick, R. P. Distribution of recently fixed photosynthate in a switchgrass plant–soil system. Plant Soil Environ. 58, 249–255 (2012).
-
Barillot, C. D. C., Sarde, C.-O., Bert, V., Tarnaud, E. & Cochet, N. A standardized method for the sampling of rhizosphere and rhizoplan soil bacteria associated to a herbaceous root system. Ann. Microbiol. 63, 471–476 (2012).
-
Young, D. D. & Schultz, P. G. Playing with the molecules of life. ACS Chem. Biol. 13, 854–870 (2018).
-
Minaba, M. & Kato, Y. High-yield, zero-leakage expression system with a translational switch using site-specific unnatural amino acid incorporation. Appl. Environ. Microbiol. 80, 1718–1725 (2014).
-
Mandell, D. J. et al. Biocontainment of genetically modified organisms by synthetic protein design. Nature 518, 55–60 (2015).
-
Rovner, A. J. et al. Recoded organisms engineered to depend on synthetic amino acids. Nature 518, 89–93 (2015).
-
Marliere, P. The farther, the safer: a manifesto for securely navigating synthetic species away from the old living world. Syst. Synth. Biol. 3, 77–84 (2009).
-
Budisa, N. Xenobiology, new-to-nature synthetic cells and genetic firewall. Curr. Org. Chem. 18, 936–943 (2014).
-
Schmidt, M. Xenobiology: a new form of life as the ultimate biosafety tool. BioEssays 32, 322–331 (2010).
-
Poudel, M. et al. The role of plant-associated bacteria, fungi, and viruses in drought stress mitigation. Front. Microbiol. 12, 743512 (2021).
-
Maksimov, I. V., Abizgil’dina, R. R. & Pusenkova, L. I. Plant growth promoting rhizobacteria as alternative to chemical crop protectors from pathogens (review). Appl. Biochem. Microbiol. 47, 333–345 (2011).
-
Dey, N., Sarkar, S., Acharya, S. & Maiti, I. B. Synthetic promoters in planta. Planta 242, 1077–1094 (2015).
-
Hou, Z., Tuo, J., Ma, X. & Huo, Y.-X. Recent advances in biosynthesis of non-canonical amino acids and their potentials in strain engineering. Results Eng. 25, 103641 (2025).
-
Xiao, H. & Schultz, P. G. At the interface of chemical and biological synthesis: an expanded genetic code. Cold Spring Harb. Perspect. Biol. 8, a023945 (2016).
-
Icking, L.-S. et al. iNClusive: a database collecting useful information on non-canonical amino acids and their incorporation into proteins for easier genetic code expansion implementation. Nucleic Acids Res. 52, D476–D482 (2024).
-
Anderson, S. R. et al. Combined biosynthesis and site-specific incorporation of phenylalanine derivatives from aryl aldehydes or carboxylic acids. Nat. Commun. 17, 6771 (2026).
-
Le Grice, S. F. J., Shih, C.-C., Whipple, F. & Sonenshein, A. L. Separation and analysis of the RNA polymerase binding sites of a complex Bacillus subtilis promoter. Mol. Gen. Genet. 204, 229–236 (1986).
-
Van Ooij, C. & Losick, R. Subcellular localization of a small sporulation protein in Bacillus subtilis. J. Bacteriol. 185, 1391–1398 (2003).
-
Haldenwang, W. G. et al. Mapping a cloned gene under sporulation control by inserttion of a drug resistance marker into the Bacillus subtilis chromosome. J. Bacteriol. 142, 90–98 (1980).
-
Itaya, M., Kondo, K. & Tanaka, T. A neomycin resistance gene cassette selectable in a single copy state in the Bacillus subtilis chromosome. Nucleic Acids Res. 17, 4410 (1989).
-
Yan, X., Yu, H.-J., Hong, Q. & Li, S.-P. Cre/lox system and PCR-based genome engineering in Bacillus subtilis. Appl. Environ. Microbiol. 74, 5556–5562 (2008).
-
Hellens, R. P., Edwards, E. A., Leyland, N. R. & Bean, S. pGreen: a versatile and flexible binary Ti vector for Agrobacterium-mediated plant transformation. Plant Mol. Biol. 42, 819–832 (2000).
-
Schroeder, J. W. & Simmons, L. A. Complete genome sequence of Bacillus subtilis strain PY79. Genome Announc. 1, e01085–13 (2013).
-
Gibson, D. G. et al. Enzymatic assembly of DNA molecules up to several hundred kilobases. Nat. Methods 6, 343–345 (2009).
-
Engler, C., Kandzia, R. & Marillonnet, S. A one pot, one step, precision cloning method with high throughput capability. PLoS ONE 3, e3647 (2008).
-
Koo, B. M. et al. Construction and analysis of two genome-scale deletion libraries for Bacillus subtilis. Cell Syst. 4, 291–305 (2017).
-
Clough, S. J. & Bent, A. F. Floral dip: a simplified method for Agrobacterium-mediated transformation of Arabidopsis thaliana. Plant J. Cell Mol. Biol. 16, 735–743 (1998).
-
Shimada, T. L., Shimada, T. & Hara-Nishimura, I. A rapid and non-destructive screenable marker, FAST, for identifying transformed seeds of Arabidopsis thaliana. Plant J. Cell Mol. Biol. 61, 519–528 (2010).
-
Lobet, G., Pagès, L. & Draye, X. A novel image-analysis toolbox enabling quantitative analysis of root system architecture. Plant Physiol. 157, 29–39 (2011).
-
Zhong, V., Gevorgyan, A. & Brophy, J. Genetic code expansion enables plant-directed control of bacterial activity (Source Data 1). Zenodo https://doi.org/10.5281/zenodo.21708042 (2026).
-
Zhong, V., Karunadasa, S., Xu, S.-L. & Brophy, J. Genetic code expansion enables plant-directed control of bacterial activity. PRIDE https://www.ebi.ac.uk/pride/archive/projects/PXD084218 (2026).
Acknowledgements
We thank collaborators who provided plant seeds and bacterial strains, specifically, J.-G. Kim and M. B. Mudgett at Stanford University for providing tomato seeds, C. Dervins and M. Kirst from the University of Florida for providing poplar cuttings and a propagation protocol, H. Bais from the University of Delaware for providing B. subtilis UD1022 and D. Stork at Harvard University for providing B. subtilis constructs and GCE protocols. We thank C. Fromen and E. Sudduth for access to and training on the flow cytometer at the University of Delaware. We thank N. Farny at Worcester Polytechnic Institute for providing protocols and guidance on microbial extractions from soil. We thank Y. Dho, J. Liu, S. Niehs, D. Wengier and E. Sattely for access to and training on the lyophilizer and LC–MS at Stanford University, as well as guidance on LC–MS experiment design and data interpretation. We thank B. Caliando for the luciferin–agarose protocol.
Funding
This work was supported by grants from the Defense Advanced Research Projects Agency (D24AC00011-05 to J.A.N.B. and A.M.K.), the Foundation for Food and Agriculture Research New Innovator Award (FF-NIA21-0000000060 to A.M.K.), the US Department of Agriculture (2021-33522-35807 to A.M.K.), the US National Science Foundation (DGE-2146755 to V.Z. and A.A.J., NSF-GRFP 1940700 to A.M.F., NSF-IOS-CAREER 2340175 to J.A.N.B. and NSF-MCB-2027092 to A.M.K.), Siebel Scholar award to V.Z., the National Institutes of Health (T32 GM15466301 to A.G., S10OD030441 to S.-L.X.), the Carnegie Endowment Fund to the Carnegie MS Facility, Stanford Shriram Synthetic Biology for Sustainability seed grant (AY2025 to J.A.N.B.), the Burroughs Wellcome Fund Career Award at the Scientific Interface (1019493.01 to J.A.N.B.) and a Chan Zuckerberg Biohub San Francisco Investigatorship (to J.A.N.B.).
Ethics declarations
Competing interests
V.Z., M.A.J., A.C., A.G., A.M.F., A.M.K. and J.A.N.B. are coinventors on filed provisional patent application no. PCT/US24/58838 related to this work. A.M.K. is a cofounder of the commercial entity Nitro Biosciences. The other authors declare no competing interests.
Peer review
Peer review information
Nature Biotechnology thanks Nediljko Budisa and the other, anonymous, reviewer(s) for their contribution to the peer review of this work. Peer reviewer reports are available.
Additional information
Publisher’s note Springer Nature remains neutral with regard to jurisdictional claims in published maps and institutional affiliations.
Extended data
Extended Data Fig. 1 LC-MS detection of OMY and L-tyrosine in Nicotiana and Arabidopsis.
(a) Representative extracted ion chromatography (EIC) traces at the m/z for OMY (left) and L-tyrosine (right) from LC-MS analysis of Nicotiana benthamiana leaf extracts. Lyophilized leaf disc samples and standards were prepared in 80% methanol, which served as the blank for the LC-MS run. Negative control was an uninfiltrated leaf. OMY 30 µM is the commercial standard. (b) Representative extracted ion chromatography (EIC) traces at the m/z for OMY (left) and L-tyrosine (right) from LC-MS analysis of metabolites extracted from conditioned hydroponic growth media. Lyophilized root exudate samples and standards were prepared in 80% methanol, which served as the blank for the LC-MS run. OMY 5 µM is the commercial standard.
Extended Data Fig. 2 Additional controls for OMY-dependent luciferase expression in B. subtilis PY79 co-cultivated with Arabidopsis.
(a) Co-cultivation of B. subtilis PY79 expressing the OMY-independent luciferase reporter with wild-type Col-0 (top, grey), proUBQ10::sfGFP-MfnG (middle, pink) or proBRN1::sfGFP-MfnG (bottom, orange) Arabidopsis seedlings. (b) Co-cultivation of wild-type B. subtilis PY79 with wild-type Col-0 (top, grey), proUBQ10::sfGFP-MfnG (middle, pink) or proBRN1::sfGFP-MfnG (bottom, orange) Arabidopsis seedlings. (c) Co-cultivation of B. subtilis PY79 expressing the OMY-independent luciferase reporter containing two stop codons with wild-type Col-0 (grey), proUBQ10::sfGFP-MfnG (pink), proBRN1::sfGFP-MfnG (orange), or proXVE::sfGFP-MfnG (blue) Arabidopsis seedlings. For proXVE::sfGFP-MfnG experiments, 0 µM (top) or 20 µM (bottom) ꞵ-estradiol was added to the bacteria-agar matrix to induce sfGFP-MfnG expression. In all panels, seedlings were transferred onto bacterial-agar matrix at 8 days post-stratification and co-cultivated for 4 days before imaging. Luminescence (30 s exposure, left) and brightfield (right) images were collected with iBright imager. Colorbar represents luminescence intensity (Fire LUT). Line graphs show luminescence intensity profile across the x-axis of the co-cultivation plate; lines connect discrete points representing the vertically averaged pixel intensity at each location. Bar charts show fold change in luminescence intensity, calculated as the ratio of intensity at each peak to the average intensity at adjacent midpoints between peaks; individual data points represent single peaks corresponding to individual biological replicates (n = 5 seedlings for all genotypes except the XVE; n = 6 XVE seedlings). All bar plots indicate the median fold change with error bars showing the interquartile range. Panel (c) shows uncropped versions of images presented in Figs. 2 and 4.
Extended Data Fig. 3 Consistency of growth phenotypes across independent T-DNA insertion lines.
(a-b) Primary root length (a) and lateral root density (b) of independent homozygous proUBQ10::sfGFP-MfnG (magenta) and proBRN1::sfGFP-MfnG (yellow) T-DNA insertion lines. Plants were phenotyped at 8 days post-stratification. Dots represent individual biological replicates (Col0; n = 11 seedlings, proUBQ10 lines 1 & 2; n = 11 seedlings, proBRN1 line 1; n = 11 seedlings, proBRN1 lines 2-4; n = 12 seedlings). Box plot central bars show the median, hinges indicate the first and third quartiles, and whiskers indicate minima and maxima. (c-d) Primary root length (c) and lateral root density (d) of independent T3 homozygous proXVE::sfGFP-MfnG lines. Box plots show the median of 21 plants phenotyped at 11 days post-stratification. Box plot hinges indicate the first and third quartiles. For all panels, significance groups were determined using two-sided Kruskal-Wallis tests with Dunn’s post-hoc analysis. Different letters indicate a statistically significant difference between groups (α = 0.05); groups sharing at least one letter are not significantly different from each other.
Extended Data Fig. 4 B. subtilis growth and protein expression with OMY.
(a) Growth of PY79 expressing the amino-acyl tRNA synthetase and tRNA for ncAA incorporation in 1/2x MS media supplemented with 1.5% sucrose, 10 mM L-glutamate, and varying concentrations of OMY at 30°C. Each plot contains the growth for three individual biological replicates. The OMY concentration is indicated in the lower right corner of each plot. (b) Growth rates calculated for curves in (a). Data show mean and standard deviation across three biological replicates. Statistical significance was determined using one-way ANOVA and Dunn’s test against the no OMY control (α = 0.05). (c, d) Fluorescence of B. subtilis PY79 (c) or UD1022 (d) expressing an OMY-dependent mNeonGreen reporter across a range of OMY concentrations in 1/2x MS media supplemented with 1.5% sucrose and 10 mM L-glutamate at 22°C. Fluorescence measured via flow cytometry. Data are the mean of three replicates derived from independently inoculated cultures that were grown and collected simultaneously. Error bars are s.d., and dots represent individual data points. Statistical significance was evaluated using a one way ANOVA with Tukey HSD posthoc test (starred p-values for (c) are 0.033; 0.05 µM OMY, 0.000000000002; 0.5 µM OMY, <0.000000000001; 5 µM OMY, <0.000000000001; 50 µM OMY, and for (d) 0.000056; 0.5 µM OMY, <0.000000000001; 5 µM OMY, <0.000000000001; 50 µM OMY). (e) Growth of UD1022 in 1/2x MS media supplemented with 1.5% sucrose, 10 mM L-glutamate, and varying concentrations of OMY at 30°C with three biological replicates. (f) The calculated growth rates for each curve in (e). Statistical significance was determined using one-way ANOVA and Dunn’s test against the no OMY control (α = 0.05).
Extended Data Fig. 5 Investigation of OMY phytotoxicity mechanisms and germination phenotypes.
(a) Primary root length of proUBQ10::sfGFP-MfnG seedlings supplemented with 0 µM or 50 µM l-tyrosine at 6 and 11 days post-stratification. Each data point represents an individual biological replicate (0 µM tyr; n = 38 seedlings, 50 µM tyr; n = 40 seedlings); only germinated seeds were included. Box plot central bars show the median, hinges indicate the first and third quartiles, and whiskers indicate minima and maxima. Statistical significance was assessed by a two-sided Mann-Whitney test. (b) Primary root length of proUBQ10::sfGFP-MfnG seedlings supplemented with 0 µM or 50 µM l-phenylalanine at 11 days post-stratification. Each data point represents an individual biological replicate (0 µM phe; n = 9 seedlings, 50 µM phe; n = 9 seedlings); only germinated seeds were included. Box plot central bars show the median, hinges indicate the first and third quartiles, and whiskers indicate minima and maxima. Statistical significance was assessed by a two-sided Mann-Whitney test. (c-d) Violin plots showing the mean abundance (n = 3) for all detected protein species in WT and proUBQ10::sfGFP-MfnG shoot (c) and root (d) tissue, corresponding to Fig. 3f-g. Two-sided unpaired student’s t-test, p > 0.05. Dashed lines mark the median and dotted lines mark quartiles. Dots are individual protein species. (e) Germination of wild-type Col-0 and proUBQ10::sfGFP-MfnG seeds at 3 months and 14 months post-harvest. Percent germination assessed at 4 days post-stratification. (f) Germination of wild-type Col-0 seeds at 2 days and 4 days post-stratification across a range of OMY concentrations. One-tailed Fisher’s exact test used to evaluate statistical significance (p = 1e-4).
Extended Data Fig. 6 OMY-dependent gene expression in Bacillus subtilis UD1022 in soil.
(a) Workflow for testing OMY-dependent gene expression in soil. Cells were washed, diluted, and inoculated into autoclaved soil with OMY and IPTG as indicated. Bacteria were extracted after 1 or 3 days by adding PBS to soil and filtering through a 10 μm membrane before analysis by flow cytometry. (b) Representative flow cytometry histograms containing 10,000 events of UD1022 expressing an OMY-dependent mNeonGreen reporter (TAG.mNeonGreen) extracted from soil planted with proUBQ10::sfGFP-MfnG or wild-type Arabidopsis seedlings. Dashed line indicates the fluorescence of the top 5% of UD1022 wild-type extracted from soil with proUBQ10::sfGFP-MfnG, shown as a reference threshold. Colors correspond to samples as indicated in (c-d). (c-d) Median fluorescence (c) and percent of population fluorescent (d) for the same samples as (b).
Extended Data Fig. 7 Additional controls for OMY-dependent luciferase expression in B. subtilis UD1022 co-cultivated with Arabidopsis.
iBright images of B. subtilis UD1022 co-cultivated with wild-type Col-0 (a) or proUBQ10::sfGFP-MfnG (b) Arabidopsis seedlings. Composite images overlay luminescence (ChemiBlot channel, 10 s exposure) with brightfield (Membrane channel, auto-exposure). Colorbar represents luminescence intensity (Fire LUT). Scale bars, 1 cm.
Extended Data Fig. 8 Fluorescence marker confirms successful hairy root transformation.
Fluorescence images of tomato (top) and poplar (bottom) composite plants expressing mStayGold in transgenic hairy roots, confirming successful R. rhizogenes-mediated transformation. Images acquired with GFP channel settings in iBright (Ex: 455-485 nm, Em: 508-557 nm, 15 ms exposure). Scale bars, 1 cm.
Supplementary information
Source data
Rights and permissions
Open Access This article is licensed under a Creative Commons Attribution-NonCommercial-NoDerivatives 4.0 International License, which permits any non-commercial use, sharing, distribution and reproduction in any medium or format, as long as you give appropriate credit to the original author(s) and the source, provide a link to the Creative Commons licence, and indicate if you modified the licensed material. You do not have permission under this licence to share adapted material derived from this article or parts of it. The images or other third party material in this article are included in the article’s Creative Commons licence, unless indicated otherwise in a credit line to the material. If material is not included in the article’s Creative Commons licence and your intended use is not permitted by statutory regulation or exceeds the permitted use, you will need to obtain permission directly from the copyright holder. To view a copy of this licence, visit http://creativecommons.org/licenses/by-nc-nd/4.0/.
About this article

Cite this article
Zhong, V., Jones, M.A., Cabales, A. et al. Genetic code expansion enables plant-directed control of bacterial activity. Nat Biotechnol (2026). https://doi.org/10.1038/s41587-026-03360-5
-
Received:
-
Accepted:
-
Published:
-
Version of record:
-
DOI: https://doi.org/10.1038/s41587-026-03360-5