Main
Hypertensive disorders of pregnancy (HDPs), including gestational hypertension (GHTN), preeclampsia, chronic hypertension (CHTN) with superimposed preeclampsia (PEC) and eclampsia, affect 2–15% of pregnancies and represent the second leading cause of maternal mortality worldwide1. HDPs increase the risk of acute maternal complications such as renal dysfunction, pulmonary edema, stroke and death2 and contribute to adverse fetal outcomes, including small for gestational age, preterm delivery and stillbirth3. Long-term, they are associated with elevated maternal risk of hypertension, coronary artery disease, stroke and vascular dementia4,5,6 and elevated offspring risk of cardiovascular and neurodevelopmental disorders7.
Despite their burden, HDPs are typically diagnosed after 20 weeks of gestation, when symptoms such as hypertension, proteinuria or organ dysfunction become clinically apparent. Severe features, including systolic blood pressure (BP) ≥ 160 mmHg or diastolic BP ≥ 110 mmHg, thrombocytopenia and visual symptoms, guide early delivery decisions because of high maternal–fetal risk8. Among HDPs, early-onset preeclampsia (EOPE, symptoms appear before 34 weeks) tends to present with more severe complications than late-onset preeclampsia (LOPE). Notably, recent systems biology studies suggest that preeclampsia is not a single disease entity but may reflect multiple distinct biological pathways, with EOPE more frequently associated with placental dysfunction and LOPE more often associated with maternal processes9,10.
Mechanistically, preeclampsia is believed to arise, in part, from maternal vascular inflammation and thrombosis that disrupt placental development9,11. Inflammation and thrombosis may impair deep placental invasion12 of the maternal decidua between 10 and 16 weeks of gestation and contribute to later placental injury, including placental atherosis13,14,15,16, a process that shares features with vascular pathology observed in cardiovascular disease. These early deviations from physiologic placentation precede clinical symptoms by weeks or months, underscoring the need for early biomarkers of systemic and placental vascular stress.
From a health systems perspective, HDPs accounted for an estimated 2.18 billion USD in US healthcare costs per year (estimated in 2012), largely driven by preterm birth complications17. Their incidence has increased in subsequent years18,19,20 and pregnancies complicated by HDPs typically end approximately 3 weeks earlier than normotensive pregnancies21. Importantly, randomized trials show that early initiation of low-dose aspirin (before 16 weeks) can reduce the risk of preterm delivery with preeclampsia by up to 62%22,23 but this requires early, accurate risk identification.
Current diagnostic criteria for preeclampsia rely on late-onset symptoms (hypertension, proteinuria and end-organ dysfunction) that usually manifest in the third trimester24. While known risk factors (for example, prior HDPs, diabetes, obesity and age) provide some predictive value, they lack individual-level accuracy25. The sFlt-1/PlGF ratio is the most validated biomarker but is primarily useful later in pregnancy and in individuals with suspected preeclampsia to aid short-term clinical assessment26. First-trimester screening tools, such as the Fetal Medicine Foundation (FMF) risk calculator27, combine clinical variables with biomarkers or ultrasound but these protocols are expensive, logistically complex and inconsistently implemented28,29. In routine practice, prevention-oriented risk stratification is often reduced to clinical risk factor assessment for aspirin eligibility, which may miss individuals with emerging vascular dysfunction while also identifying broad high-risk groups with limited precision.
Increasing evidence suggests a link between placental vascular changes associated with preeclampsia and alterations in the retinal vasculature. Studies of women with established preeclampsia describe retinal signs resembling hypertensive retinopathy, arteriolar narrowing and choroidal changes30,31,32,33,34 and link preeclampsia to increased future risk of retinal diseases35. Further, recent evidence has identified an association between the sFlt-1/PlGF ratio and choroidal thickness as measured by optical coherence tomography (OCT)33,36. A prior postpartum study from our team (31 severe preeclampsia cases and 35 normotensive controls) demonstrated significantly increased median tortuosity in the inferotemporal retinal artery among individuals with preeclampsia37. OCT angiography has revealed that pregnant women who go on to develop placental insufficiency have significantly narrower retinal blood vessels (arterioles and venules) compared to normotensive pregnancies38. These individuals also exhibit reduced capillary density. In separate studies, women with preeclampsia had significantly lower vessel densities in both the superficial and deep capillary plexuses, including in the foveal and parafoveal regions, relative to healthy pregnant or nonpregnant controls39,40. These findings suggest a degree of capillary dropout or ‘vascular rarefaction’ in the retinas of women with preeclampsia. Retinal vessel caliber reduction and reduced perfusion density are consistent with systemic vasoconstriction and endothelial dysfunction, both hallmarks of preeclampsia pathophysiology. Importantly, these changes may be subclinical and may emerge before overt clinical diagnosis, suggesting that the maternal retina could provide a noninvasive window into systemic vascular remodeling during pregnancy.
Initial efforts to apply AI to HDP prediction using retinal imaging have been promising but limited. The PROMPT model (preeclampsia risk factor + ophthalmic data + mean arterial pressure prediction test)41 relied heavily on clinical variables (for example, mean arterial pressure) and achieved modest image-only performance using cross-validation at a single site (area under the curve (AUC) = 0.74). Another study combining 45° retinal fundus images with clinical data reported improved accuracy but used a convolutional neural network (CNN) architecture that lacks interpretability and biological insight42. Notably, both studies were conducted in homogeneous East Asian populations, further limiting their generalizability and translational impact. Although not originally designed for preeclampsia (or any other pregnancy disorder), RETFound43 is a retinal foundation model that was validated across diverse disease classification tasks. However, direct image-level foundation-model fine-tuning may require larger numbers of outcome events than are typically available in prospective pregnancy cohorts, motivating approaches that reduce image dimensionality while preserving biologically meaningful vascular structure.
Here we introduce Visionary AI, an end-to-end computational framework that takes as input retinal images and predicts an individual’s risk of HDPs. Unlike prior approaches that treat retinal images as opaque inputs to generic deep-learning models, Visionary AI models the retinal vasculature as a quantifiable, interpretable biological system—one that may reflect systemic endothelial and angiogenic processes occurring during placental development.
We show across a cohort of 1,267 pregnant participants that this framework enables accurate and interpretable prediction of preeclampsia and GHTN months before clinical diagnosis. We further develop a stability-optimized model that reduces complexity and transfers to an independent New York University (NYU) validation cohort without retraining or optimization using NYU outcome labels. By benchmarking Visionary AI against the FMF risk calculator, real-world aspirin-eligibility criteria and RETFound foundation model, we evaluate whether retinal vascular modeling provides information beyond established clinical and image-level deep-learning approaches. Together, these results establish retinal vascular phenotyping as a promising new dimension of pregnancy risk assessment and position Visionary AI as an interpretable, noninvasive framework for detecting early systemic vascular remodeling before HDPs become clinically apparent.
Results
Cohort characteristics and study design
We analyzed retinal imaging and clinical data from a Columbia University (CU) development cohort and an independent NYU external validation cohort.
The CU cohort included 1,267 pregnant individuals receiving prenatal care at NewYork-Presbyterian/CU Irving Medical Center between 2021 and 2025 (Extended Data Table 1). Within the CU cohort, 55 participants developed preeclampsia (4.3%). One participant with preeclampsia was excluded from retinal image analysis because of poor image quality, yielding 54 preeclampsia cases for retinal-model analyses. Retinal images were acquired during the first, second and third trimesters using the Optos scanning laser ophthalmoscope Primary ultrawidefield imaging system.
The independent NYU external validation cohort included 79 pregnant individuals receiving prenatal care at the Mignone Women’s Health Collaborative at NYU Langone Health between 2025 and 2026 (Extended Data Table 2). Within the cohort, 14 participants were diagnosed with preeclampsia during routine prenatal care (17.7%), representing a higher observed prevalence than the annual average prevalence of preeclampsia at NYU Langone Health (~8%). Because predictive values and precision-based metrics are sensitive to outcome prevalence, prevalence-adjusted performance estimates are reported below for both cohorts. One participant with preeclampsia was excluded from retinal image analysis because of poor image quality, yielding 13 preeclampsia cases for retinal-model analyses. NYU images were acquired during the first, second and third trimesters using the Optos California ultrawidefield imaging system.
In both cohorts preeclampsia diagnoses were given according to 2013 American College of Obstetricians and Gynecologists (ACOG) criteria8 during prenatal care and independently reviewed by maternal–fetal medicine specialists masked to retinal imaging results. Preeclampsia cases were further categorized by severity and timing of onset, including preeclampsia with severe features (SF), preeclampsia without severe features (NSF), EOPE and LOPE; detailed definitions are provided in the Methods. Preeclampsia subtype-specific analyses were treated as descriptive evaluations of model behavior across clinical presentations rather than separately trained subtype-specific models.
Extended Data Tables 1 and 2 summarize demographic, clinical and pregnancy-outcome characteristics for the CU and NYU cohorts. Collected variables included maternal age, height, weight, race and ethnicity, tobacco use, obstetric history, preexisting conditions, medication exposures, pregnancy complications and birth outcomes, including small for gestational age, severe small for gestational age, stillbirth, birth weight and Apgar scores.
The CU cohort was predominantly Hispanic or Latinx, reflecting the clinical population served at the recruitment site (Supplementary Table 1). Participants who developed preeclampsia were more likely than those who did not to have a history of preeclampsia in a prior pregnancy (16.4% versus 3.8%; P = 4.1 × 10⁻⁵, chi-square test) and preexisting hypertension (18.2% versus 3.5%; P = 5.5 × 10⁻⁷, chi-square test). Participants who developed GHTN also had higher rates of obesity than normotensive population-wide (PW) controls (65% versus 33%; P = 6.5 × 10⁻⁶, chi-square test).
The NYU cohort differed from the CU cohort in several clinically relevant respects, including race and ethnicity distribution, older maternal age, higher in vitro fertilization (IVF) prevalence and higher observed preeclampsia prevalence (Supplementary Tables 1 and 2). Among participants with race information available, the NYU cohort included a larger proportion of white and Asian participants than the CU cohort. NYU imaging was also performed using the Optos California ultrawidefield system (CU cohort used the Optos Primary ultrawidefield system) within a different clinical workflow. Together, these demographic, clinical, workflow and imaging-device differences support the use of NYU as a meaningful external validation cohort rather than a near replication of the CU development cohort.
The Visionary AI Framework and evaluation strategy
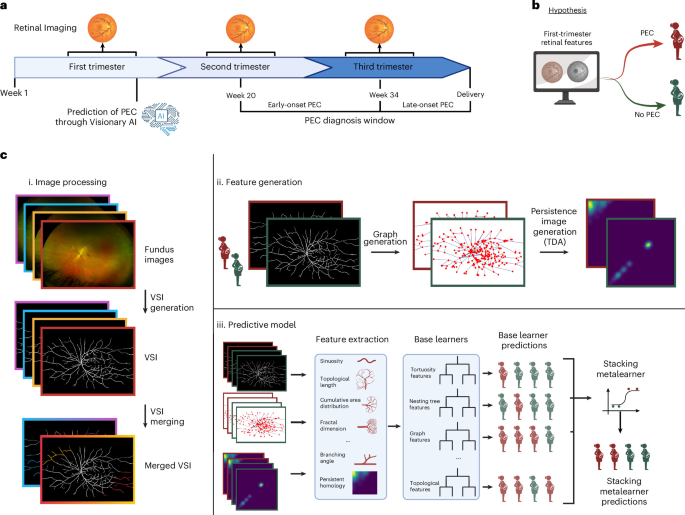
Visionary AI is an interpretable retinal vascular modeling framework that uses retinal images to quantify early-pregnancy microvascular structure and predict subsequent HDPs. Figure 1 summarizes the study design and computational workflow, including retinal image acquisition, vessel segmentation, vascular feature extraction and ensemble-based risk prediction.
a, Timeline of retinal imaging and clinical outcome ascertainment. Participants were approached for ultrawidefield retinal imaging during the first, second and third trimesters. In the CU development cohort, prediction analyses used first-trimester images when available and second-trimester images only for participants without first-trimester imaging, as specified in the corresponding analyses. The NYU external validation analysis was restricted to retinal images acquired during the first trimester, between 6 and 13 weeks of gestation. Preeclampsia diagnoses were ascertained after 20 weeks of gestation according to clinical criteria. b, Central hypothesis. Retinal vascular structure in early pregnancy contains quantifiable microvascular signatures of systemic vascular dysfunction that precede clinical diagnosis of preeclampsia. c, Visionary AI pipeline. The computational workflow consists of three modules. (i) Image processing: ultrawidefield fundus images are acquired from both eyes, converted into VSIs using a designated AI model and merged when multiple images from the same eye are available to generate a more complete retinal vascular representation. (ii) Feature generation: VSIs are transformed into graph-based, geometric and topological vascular features that quantify complementary aspects of retinal microvascular architecture. (iii) Predictive modeling: semantically grouped vascular feature sets are used to train base learners and their out-of-fold predictions are integrated by a stacked metalearner to generate the final risk prediction.
Briefly, retinal images were converted into vessel segmentation images (VSIs) using a dedicated retinal vessel segmentation AI model developed for this study. VSIs provide a binary representation of the retinal vascular tree for downstream feature extraction. When multiple images were available for a given eye, VSIs were merged to generate a more complete vascular representation for analysis. Detailed segmentation model development, image-registration and quality-control procedures are provided in the Methods.
Visionary AI then transformed each VSI into biologically interpretable vascular representations. These included graph-based features capturing branching and connectivity, geometric features capturing vessel length, caliber, curvature, angle and tortuosity and higher-order topological features capturing vascular organization and loop structures across scales (Methods and Supplementary Note 1). Together, these feature classes were designed to summarize complementary dimensions of retinal microvascular architecture rather than treat the image as an opaque input to a generic deep-learning classifier.
Extracted vascular features were grouped into semantically related feature sets and each feature set was used to train an independent base learner. Base-learner predictions were then integrated through a stacked ensemble framework in which out-of-fold base-learner predictions served as inputs to a metalearner. This architecture allowed the model to combine complementary vascular representations while preserving interpretability at the level of feature classes and retained base learners.
Because preeclampsia is a relatively rare outcome, CU model development used leave-one-out cross-validation (LOOCV) to maximize training data while generating held-out predictions for each participant. To reduce the risk of information leakage, base-learner fitting and selection and metalearner training and prediction were implemented within the cross-validation framework, with out-of-fold predictions carried forward between stages, as detailed in the Methods. Model evaluation focused on both internal CU performance and external validation. Within CU, we assessed held-out cross-validated performance and the reproducibility of selected retinal vascular representations across control populations; in parallel, we evaluated model transferability in an independent NYU external validation cohort.
Therefore, we evaluated Visionary AI across three increasingly stringent settings. First, a high-contrast analysis tested whether retinal vascular features could distinguish preeclampsia cases from a narrowly defined healthy-control group. Second, a performance-optimized CU model evaluated predictive performance across population-wide control settings within the CU development cohort. Third, to support external validation, a stability-optimized CU model was designed to prioritize reproducibility across nonoverlapping population-wide control groups rather than maximize within-site performance. This stability-optimized model used stability-based hyperparameter selection, minimum-performance and average precision (AP) variability criteria, recursive feature elimination (RFE) and feature-set deduplication to contract the candidate model space before NYU testing. The resulting model was then evaluated on the independent NYU cohort without retraining, refitting or optimization using NYU outcome labels.
Retinal vascular features predict preeclampsia across increasingly stringent evaluation settings
High-contrast CU analysis identifies preeclampsia-associated retinal vascular signal
We first evaluated Visionary AI in a high-contrast CU analysis to determine whether retinal vascular features captured in early pregnancy contained detectable signals associated with subsequent preeclampsia. In this analysis, preeclampsia cases were compared to a narrowly defined healthy-control group selected to minimize medical, ocular, medication-related and pregnancy-related conditions that could independently influence retinal vascular structure. Healthy controls were drawn from singleton pregnancies without documented preexisting maternal comorbidities, ocular conditions, relevant medication exposures or pregnancy complications; detailed exclusion criteria are provided in the Methods. From 176 eligible healthy controls, 82 were selected to preserve class balance and support approximate matching on key demographic and imaging variables.
Visionary AI distinguished participants who later developed preeclampsia from healthy controls with high apparent performance (n = 136, including 54 preeclampsia cases; AUC = 0.94, AP = 0.92, positive predictive value (PPV) = 0.85; Extended Data Fig. 1). We interpret this analysis as an initial proof of signal rather than as the primary estimate of clinical performance, as the comparison was intentionally enriched for phenotypic contrast. Therefore, we subsequently evaluated Visionary AI on broader population-wide CU control settings and on an independent NYU external validation cohort as detailed below.
Population-wide CU analyses support preeclampsia prediction in a clinically heterogeneous obstetric population
We next evaluated whether the retinal vascular signal identified in the high-contrast analysis persisted when preeclampsia cases were compared to broader population-wide controls from the CU cohort. Unlike the selected healthy-control analysis, these population-wide controls were drawn from the larger nonpreeclampsia obstetric population and were intended to better reflect the clinical heterogeneity encountered in prenatal care. We refer to this model as the ‘performance-optimized retinal model’, reflecting its optimization for predictive performance within the CU population-wide evaluation framework.
Exclusions from the population-wide control pool were limited to prespecified conditions that could confound the outcome definition or preclude valid retinal-model evaluation, including multifetal gestation, HELLP syndrome, other maternal hypertensive disorders, stillbirth and unavailable or low-quality retinal images (Methods). This design retained participants with common clinical comorbidities, including CHTN, diabetes (gestational and chronic), obesity and fetal outcomes such as growth restriction, thereby providing a more heterogeneous internal evaluation than the healthy-control contrast.
Across repeated CU population-wide control samplings, the performance-optimized retinal model maintained strong discriminative performance for preeclampsia, achieving an AUC of 0.91 ± 0.05 and an AP of 0.81 ± 0.11 across sampled control sets (Fig. 2a,b). Because this evaluation used sampled control sets rather than analyzing the full population-wide control pool at once precision–recall (PR) metrics and PPV estimates from these sampled sets should not be interpreted as real-world screening performance at the observed CU preeclampsia prevalence. Therefore, we report threshold-based operating characteristics, including prevalence-adjusted PPV and negative predictive value (NPV), in Extended Data Table 3. Together, these results show that retinal vascular features remained predictive in a broader and more clinically heterogeneous CU control population, with the modest reduction in performance relative to the high-contrast analysis likely reflecting greater biological and imaging heterogeneity.
a, ROC and PR curves for the performance-optimized Visionary AI model, the FMF risk calculator and a combined Visionary AI + FMF model within the CU population-wide evaluation framework. The analysis included 1,137 unique CU participants, including 54 preeclampsia cases. Each sampled evaluation set included 82 selected healthy controls and approximately 100 additional unique population-wide controls (Methods). In ROC plots, the diagonal line indicates no-discrimination performance (equivalent to random classification; AUC = 0.5). In PR plots, the horizontal line indicates the expected precision of a random classifier, corresponding to the prevalence of the positive class in the respective evaluation set. Shaded areas indicate 95% pointwise confidence intervals constructed using the mean ± 1.96 × s.e.m. across ten population-wide groups. Panel legends report the AUC and AP as the mean ± s.d. Visionary AI achieved higher AUC and AP than FMF. Combining Visionary AI predictions with FMF probabilities did not materially improve performance over Visionary AI alone. b, Threshold-based operating characteristics of the performance-optimized Visionary AI model across preeclampsia subtypes, based on the overall preeclampsia model. Bar plots show the AUC, PPV, NPV and TPR at the prespecified classification threshold of 0.5; the corresponding FPR was 0.08 for all subtype evaluations. Because PPV and PR metrics are prevalence dependent, the values shown reflect the sampled CU population-wide evaluation structure; prevalence-adjusted metrics standardized to a 4% preeclampsia prevalence in CU are provided in Extended Data Table 3. c, Metalearner importance of retained base learners, aggregated across folds, in the performance-optimized Visionary AI model. Base learners are annotated according to their retinal vascular categories, including vessel extension and initiation, vessel curvature and caliber, loop redundancy or resilience and vascular organization and sparsity. LR, logistic regression; RF, random forest; XGB, extreme gradient boosting.
Combining Visionary AI with probabilities from the FMF risk calculator27, an established clinical risk prediction tool based on maternal clinical features and pregnancy-related risk factors (Methods), did not materially improve predictive performance relative to Visionary AI alone (AUC = 0.90 ± 0.06, AP = 0.80 ± 0.11). Throughout the retinal-model analyses, we accounted for first pregnancy and prior preeclampsia history as minimal obstetric-history adjustment variables (Methods); however, the primary predictive signal was derived from retinal vascular features rather than from a broader clinical risk model (Fig. 2c). These results suggest that retinal imaging features captured most of the signal relevant to preeclampsia risk in the CU population-wide analysis, with limited incremental contribution from FMF-derived clinical risk information.
Because subtype-specific case counts were limited, analyses of SF, NSF, EOPE and LOPE were treated as post hoc stratified evaluations of the same overall preeclampsia model rather than as separately trained subtype-specific classifiers. Visionary AI, trained on all preeclampsia cases, maintained consistent predictive performance across clinical presentations, including SF (n = 38), NSF (n = 16), EOPE (n = 20) and LOPE (n = 34). At an operating point corresponding to a false positive rate (FPR) of 0.08, the true positive rate (TPR) exceeded 0.70 for each subtype (Fig. 2b). To further characterize subtype performance across a range of operating points, Supplementary Tables 3–5 report mean confusion-matrix counts and performance metrics across the ten performance-optimized population-wide control sets at thresholds targeting FPRs of up to 10%, 20% and 30%, respectively. These post hoc analyses suggest that the retinal vascular signal was not restricted to a single preeclampsia presentation, while also underscoring the need for larger cohorts to estimate subtype-specific performance more precisely.
A stability-optimized model reduces complexity and prioritizes reproducible retinal vascular signal
Although the performance-optimized retinal model demonstrated strong predictive performance within CU population-wide analyses, it was designed to maximize internal performance within this population. To further evaluate the robustness of the retinal vascular signal and assess whether predictive performance could be maintained under a more constrained modeling framework, we next developed a stability-optimized model designed to prioritize reproducibility across nonoverlapping population-wide control groups rather than peak performance in any single CU control setting.
For the stability-optimized model, we used a control definition that was similar to the performance-optimized population-wide analysis but deliberately more inclusive of the clinical heterogeneity encountered in routine obstetric care. Unlike the performance-optimized model, participants with HDPs other than preeclampsia, including GHTN, were retained in the control pool rather than excluded. Furthermore, in this model, each healthy control was included only once, and the healthy-control group together with the expanded population-wide control pool, including GHTN and CHTN, was divided into five nonoverlapping control settings (Methods). Hyperparameter configurations were selected on the basis of low variability in AP and high minimum AUC across these settings, thereby favoring base learners with consistent performance across control definitions (Supplementary Fig. 1). Candidate base learners that did not meet minimum stability and performance criteria were removed before metalearner training.
This stability-based procedure substantially reduced model complexity. The initial search space included 96 candidate base learners, representing 32 retinal vascular feature sets across three model classes. After stability-based hyperparameter selection and RFE, each leave-one-out stability-optimized model retained eight nonredundant base learners per fold. To construct the final model for each population-wide control group, we took the union of base learners selected across leave-one-out folds and retained eight nonredundant learners by prioritizing higher-importance models and removing redundant feature sets (Extended Data Fig. 2 and Methods). Thus, the model used for external validation was intentionally constrained to a small set of reproducible retinal vascular representations rather than optimized solely for maximal internal CU performance.
Despite this reduction in model complexity, the stability-optimized model preserved predictive signal in the CU population-wide analyses, supporting the robustness of the selected retinal vascular features (Fig. 3a). Recurrent vascular feature categories and base learners, including graph-based topology, box counting, cumulative size distribution, vessel length or angle and tortuosity-related representations, were repeatedly selected and assigned high importance across population-wide settings (Fig. 3b,c and Supplementary Fig. 2). This consistency across distinct control settings suggests that model performance was driven by stable retinal microvascular representations associated with preeclampsia risk, rather than by control-set-specific patterns, fold-specific model components or unstable feature-selection artifacts.
a, ROC and PR curves for the stability-optimized Visionary AI model evaluated in the CU population-wide cohort (n = 1,188; 54 preeclampsia cases). In ROC plots, the diagonal line indicates no-discrimination performance (equivalent to random classification; AUC = 0.5). In PR plots, the horizontal line indicates the expected precision of a random classifier, corresponding to the prevalence of the positive class in the respective evaluation set. Shaded areas indicate 95% pointwise confidence intervals constructed using the mean ± 1.96 × s.e.m. across five population-wide groups. Panel legends report the AUC and AP as the mean ± s.d. b, Ranked metalearner category importance across population-wide control groups. Mixed-feature base learners were excluded from the category-level analysis because they included features spanning multiple vascular categories. c, Stable selection and importance of retained base learners across CU stability-optimized population-wide models. For each population-wide control setting, RFE retained eight base learners within each leave-one-out fold. Final retained base learners were selected by prioritizing average importance across folds while removing base learners trained on redundant feature sets. The heat map shows metalearner importance for retained base learners; model classes are indicated in parentheses.
The stability-optimized model generalizes to the independent NYU validation cohort
We next evaluated whether the stability-optimized CU model generalized to an independent external validation cohort collected at NYU. This analysis was designed as the primary external test of the retinal vascular signal identified in the CU cohort. The NYU cohort differed from the CU development cohort in institution, population, clinical workflow and ultrawidefield imaging-device configuration and the validation analysis was restricted to retinal images during the first trimester, acquired between 6 and 13 weeks of gestation. The stability-optimized model was evaluated in NYU without retraining, refitting or hyperparameter optimization using NYU outcome labels.
Despite these differences in site, population, imaging workflow and clinical setting, Visionary AI maintained robust predictive performance in the independent NYU validation cohort, achieving an AUC of 0.81 and an AP of 0.68 (Fig. 4a). Performance was also preserved in differential-diagnosis analyses distinguishing preeclampsia from other HDPs, including GHTN and CHTN, as well as in subgroup analyses stratified by demographic characteristics, clinical risk factors and quality-control metrics (Extended Data Fig. 3 and Supplementary Figs. 3–5).
a,b, ROC (left) and PR (right) curves for the stability-optimized model evaluated on the independent NYU external validation cohort (a; n = 66, 13 preeclampsia cases) and ‘the aspirin-recommended subgroup analysis’ (b; n = 33, eight preeclampsia cases). In ROC plots, the diagonal line indicates no-discrimination performance (equivalent to random classification; AUC = 0.5). In PR plots, the horizontal line indicates the expected precision of a random classifier, corresponding to the prevalence of the positive class in the respective evaluation set.
Unlike the CU population-wide analyses, the NYU validation did not rely on repeated or balanced sampled control sets. Thus, threshold-based PPV and NPV calculated directly from this cohort reflect the observed preeclampsia prevalence in the NYU validation set. At a stringent operating point, Visionary AI achieved an FPR of 0.02, TPR of 0.46, PPV of 0.86 and NPV of 0.88; at a less stringent operating point, Visionary AI achieved an FPR of 0.13, TPR of 0.69, PPV of 0.56 and NPV of 0.92 (Extended Data Table 4). Because the observed preeclampsia prevalence in the NYU validation cohort was higher than the annual average prevalence at NYU Langone Health (approximately 8%), we additionally report prevalence-adjusted PPV and NPV using the institutional annual prevalence estimate. Under this prevalence-adjusted setting, the stringent operating point corresponded to an estimated PPV of 0.68 and NPV 0.95, whereas the less stringent operating point corresponded to an estimated PPV of 0.31 and NPV of 0.97 (Extended Data Table 4). The preservation of predictive signal in an independent, early-pregnancy validation cohort supports the transferability of the retinal vascular features selected by the stability-optimized CU model.
Together, these findings show that the constrained stability-optimized model retained predictive signal beyond the CU development setting. The successful transfer of the stability-optimized model across sites, clinical workflows, populations and imaging-device configurations supports the interpretation that Visionary AI captures reproducible retinal microvascular signatures associated with preeclampsia risk rather than CU-specific control-set artifacts or unstable ensemble behavior.
Visionary AI complements established clinical risk-stratification approaches
We next evaluated Visionary AI against established clinical risk-stratification approaches for preeclampsia. To provide a clinically relevant benchmark and avoid potential bias associated with locally trained or modified FMF implementations, we used the official FMF risk calculator portal directly for the independent NYU validation cohort. This analysis used the available maternal demographic, clinical and family-history variables required by the FMF first-trimester risk assessment framework, including maternal age, height, weight, racial origin, CHTN, type 1 diabetes, smoking status, systemic lupus erythematosus, method of conception, obstetric history and family history of preeclampsia (Methods).
In the NYU external validation cohort, Visionary AI outperformed FMF across both receiver operating characteristic (ROC) and PR analyses, achieving an AUC of 0.81 and an AP of 0.68, compared to FMF AUC of 0.73 and AP of 0.50 (Fig. 4a). At clinically relevant low-FPR operating points, Visionary AI also achieved higher sensitivity and precision than FMF. At a stringent threshold (FPR of 0.02), Visionary AI achieved a TPR of 0.46 and prevalence-adjusted PPV of 0.68. At a less stringent threshold, Visionary AI achieved an FPR of 0.13, TPR of 0.69 and prevalence-adjusted PPV of 0.31, compared to the FMF FPR of 0.13, TPR of 0.38 and prevalence-adjusted PPV of 0.20 (Extended Data Table 4). Bootstrap resampling of the NYU cohort, stratified by outcome to preserve the observed case prevalence, yielded consistent performance estimates, quantified uncertainty around the ROC, PR and threshold-based metrics and showed that Visionary AI consistently outperformed FMF (Supplementary Table 6).
We also compared Visionary AI to the clinical risk-stratification approach used at NYU to guide aspirin eligibility on the basis of ACOG guidelines at approximately 12 weeks of gestation. This benchmark reflects routine prenatal-care decision making on the basis of clinical risk factors, including IVF, maternal age over 35 years and BMI over 30 (Methods). In the NYU cohort, aspirin eligibility identified preeclampsia cases with a TPR of 0.62 but at a substantially higher FPR of 0.47 and lower prevalence-adjusted PPV of 0.1. In contrast, Visionary AI achieved a TPR of 0.69 at a FPR of 0.13 with a prevalence-adjusted PPV of 0.31. These results support the potential of Visionary AI to provide retinal vascular information that is complementary to current clinical risk-factor-based screening and prevention strategies.
As an additional sensitivity analysis, we evaluated the stability-optimized Visionary AI model within the subset of NYU participants who were recommended aspirin during pregnancy, a clinically enriched group expected to have elevated baseline risk on the basis of routine obstetric assessment (n = 33, eight preeclampsia cases). In this aspirin-recommended subgroup, Visionary AI maintained strong predictive performance, achieving an AUC of 0.95 and an AP of 0.85, compared to the FMF AUC of 0.76 and AP of 0.65 (Fig. 4b). Combining Visionary AI with FMF probabilities did not improve performance (AUC = 0.78, AP = 0.67), consistent with the broader analysis. Although this subgroup analysis is limited by sample size, the preservation of strong retinal-model performance among aspirin-recommended individuals suggests that Visionary AI captures retinal vascular information not fully represented by the clinical risk factors used to guide aspirin recommendation.
Because the CU cohort lacked some FMF variables, including family history of preeclampsia and a direct systemic lupus erythematosus variable, CU FMF comparisons were treated as secondary benchmarking analyses and interpreted with caution. Across both CU performance-optimized and stability-optimized analyses, Visionary AI showed stronger performance than FMF-derived clinical risk estimates; however, the NYU analysis represents the most complete and clinically relevant FMF comparison in the revised manuscript. Together, these results suggest that Visionary AI captures retinal vascular information that is not fully represented by existing clinical risk-stratification tools.
Visionary AI outperforms direct image-level RETFound foundation model and Inception-ResNet-v2 in limited-event clinical cohorts
We next benchmarked Visionary AI against two image-based deep-learning approaches: RETFound, a retinal foundation model, and Inception-ResNet-v2, a CNN. Both baselines were trained on the CU development cohort using participant-level LOOCV. In each iteration, all retinal images from the held-out participant were excluded together from model training, preprocessing decisions and model selection, thereby preventing image-level leakage across participants. Image-level probabilities were averaged across all available images from each participant to obtain participant-level predictions for evaluation.
RETFound was initialized using publicly available pretrained weights and fine-tuned for preeclampsia prediction for up to 25 epochs using the developers’ publicly available scripts and default fine-tuning parameters. Inception-ResNet-v2 was evaluated as a transfer-learning CNN baseline for up to 25 epochs. The pretrained convolutional backbone was held fixed and only a new classification layer was trained; thus, this analysis assessed a classification head trained on fixed pretrained image representations rather than full end-to-end fine-tuning. Training used weighted cross-entropy loss, with weights of 1 for controls and 4 for cases to account for the approximately 20% case prevalence in the training data.
For external evaluation, the CU-trained RETFound and Inception-ResNet-v2 models were applied to the independent NYU cohort without using NYU outcomes for model fitting, fine-tuning, hyperparameter or epoch selection or calibration. Under these training and evaluation configurations, both image-level baselines performed near chance in the NYU cohort (Supplementary Figs. 6 and 7), whereas Visionary AI maintained strong predictive performance in external validation. We interpret these findings cautiously, as deep-learning models may require substantially larger numbers of outcome events for effective task-specific training or fine-tuning. The results therefore do not establish that Visionary AI is generally superior to deep learning. Rather, within the evaluated sample sizes and training configurations, RETFound and Inception-ResNet-v2 did not match Visionary AI’s predictive performance. These findings are consistent with the possibility that lower-dimensional, biologically informed representations of retinal vascular topology, geometry and network organization may be advantageous in clinical cohorts with limited numbers of outcome events.
Stable retinal vascular signatures support biological interpretability of Visionary AI
Having established that Visionary AI predicted preeclampsia across CU population-wide analyses, generalized to an independent NYU validation cohort and outperformed clinical and deep-learning benchmarks, we next examined the retinal vascular representations that contributed to model predictions. Because Visionary AI is built from predefined vascular feature sets rather than opaque image-level embeddings, model interpretation could be performed across retained base learners and aggregated broader vascular categories.
Across the performance-optimized and stability-optimized CU models, importance analyses converged on recurring retinal vascular representations related to graph topology, geometry, nesting tree (that is, summarizes the hierarchical organization of loops and bifurcations) and complexity (Fig. 3b and Supplementary Fig. 8). In the performance-optimized model, graph topology and complexity-related base learners showed the highest importance, with informative base learners including box counting, fractal organization, graph topology and vessel branching angles (Fig. 2c). In the stability-optimized model, recurrent base learners, including box counting, graph-based topology, cumulative size distribution, vessel length or angle and tortuosity-related features, were repeatedly selected across nonoverlapping population-wide control groups and assigned high importance (Fig. 3c). The features within base learners were also consistently assigned high importance across control populations, illustrating the stability of vascular trait importance within base learners across population-wide control groups and folds (Supplementary Figs. 9–11). For example, the vascular traits quantified in the ‘cumulative size distribution of loops’ base learner were consistently ranked high across folds and population-wide control settings (Supplementary Fig. 9). This consistency across models and control definitions suggests that Visionary AI performance is driven by a reproducible subset of retinal vascular representations rather than control group specific feature selection, artifacts or a narrow control-selection strategy (Supplementary Note 2).
To further evaluate the biological relevance of these model-derived signatures, we performed model-independent univariate analyses of representative retinal vascular features. These analyses identified preeclampsia-associated differences in features related to vessel branching, topological length, tortuosity, vessel thickness, fractal organization, loop count and vascular asymmetry (Fig. 5 and Supplementary Note 3). Collectively, these features point to alterations in retinal vascular density, branching organization, vessel extension, curvature and network redundancy—properties that are consistent with microvascular remodeling and systemic endothelial dysfunction in HDPs.
Columns show selected retinal features from four feature categories used to construct base learners: graph topology, geometry, nesting tree and complexity. a, For each feature, boxplots compare preeclampsia cases (n = 54), healthy controls (n = 82) and population-wide controls (n = 1,134). Boxes show the IQR, center lines indicate the median, whiskers extend to the most extreme values within 1.5× the IQR and overlaid points represent individual participants. b, Schematics illustrate how each feature differs between healthy and preeclampsia-associated vascular patterns. c, Corresponding vascular properties represented by the features are shown. Branch count quantifies the number of branch nodes (black circles in b) and differs between preeclampsia cases and healthy controls (P = 0.04). Mean weighted inferior topological length shift captures differences in branch extension based on the number and weighting of nodes between the vascular root and terminal tips and differs between preeclampsia cases and healthy controls (P = 0.02) and population-wide controls (P = 0.01). Total squared-curvature tortuosity quantifies vessel curvature along the vascular path and differs between preeclampsia cases and healthy controls (P = 0.01). Loop count quantifies redundant or interconnected paths within the vascular network and differs between preeclampsia cases and healthy controls (P = 0.007). Box counting captures vascular coverage and spatial organization using features derived by partitioning the image into a grid and identifying boxes that contain vessels. In b (right), boxes containing vessels are filled, whereas boxes without vessels remain unfilled. Box counting differs between preeclampsia cases and healthy controls (P = 0.002) and population-wide controls (P = 7.04 × 10⁻6). P values were calculated using a two-sided Mann–Whitney U-test. *P < 0.05, **P < 0.01 and ***P < 0.001. HC, healthy controls.
These analyses should be interpreted as hypothesis generating rather than causal. Nevertheless, the combination of recurrent base-learner selection, consistent base-learner importance, stability across population-wide control groups and model-independent univariate differences supports the biological interpretability of Visionary AI. Together, these results suggest that preeclampsia risk is associated with early alterations in retinal microvascular topology, geometry and network organization that can be detected before clinical diagnosis.
Visionary AI generalizability across GHTN and preexisting hypertension
Lastly, we evaluated the ability of the Visionary AI framework to predict additional hypertensive disorders, specifically GHTN and CHTN diagnosed before pregnancy. Although both GHTN and preeclampsia are thought to originate in placental dysfunction44, we hypothesized that they give rise to distinct retinal vascular signatures detectable in first-trimester images. Specifically, we expect that preeclampsia and GHTN each produce unique patterns of microvascular remodeling, with preeclampsia potentially exhibiting more spatially extensive alterations. These clinical phenotypes also differ in their comorbidities; participants who developed GHTN had significantly higher rates of obesity (65% versus 33%; P = 6.5 × 10⁻⁶, chi-square test), while those who developed preeclampsia had higher rates of CHTN (18.2% versus 3.5%; P = 5.5 × 10⁻⁷, chi-square test).
To this end, we used both the performance and stability-optimized model architectures to assess our approach’s generalizability in distinguishing GHTN (49 cases) and CHTN (61 cases, excluding subjects with superimposed preeclampsia). The performance-optimized model achieved an AUC of 0.91 ± 0.05 and an AP of 0.83 ± 0.07 for GHTN (n = 1,132, including 49 GHTN cases) and an AUC of 0.90 ± 0.06 and an AP of 0.79 ± 0.12 for CHTN (n = 1,106, including 61 CHTN cases). The stability-optimized models were able to predict GHTN with an AUC of 0.80 ± 0.05 and AP of 0.50 ± 0.09 (n = 1,138, including 49 GHTN cases) and CHTN with an AUC of 0.78 ± 0.02 and AP of 0.53 ± 0.04 (n = 1,143, including 61 CHTN cases) (Fig. 6a). On the NYU external validation set GHTN (n = 7) was predicted with an AUC of 0.67, AP of 0.53, and PPV of 0.50 with a TPR of 0.43 at a 0.05 FPR (Fig. 6b). We could not evaluate performance for CHTN at NYU as there were only three cases.
a, ROC and PR curves for stability-optimized Visionary AI models predicting GHTN and CHTN in the CU population-wide evaluation framework (GHTN: n = 1,138, including 49 cases; CHTN: n = 1,143, including 61 cases, excluding individuals with superimposed preeclampsia) (top) and for the GHTN model in the NYU external validation cohort (n = 66, including seven cases (bottom). Shaded areas indicate 95% pointwise confidence intervals constructed using the mean ± 1.96 × s.e.m. across five population-wide groups. Panel legends report the AUC and AP as the mean ± s.d.; the NYU AUC and AP are reported as single-cohort estimates. b, Metalearner importance of retained base learners in the stability-optimized GHTN model across the five CU population-wide control groups. Colors denote the corresponding retinal vascular categories. The corresponding analysis for CHTN is shown in Extended Data Fig. 4.
Both the GHTN and CHTN metalearner base-learner importances included superior vessel-thickness shift (thickness of vessels at the top of the eye relative to healthy controls) and topological length (number of vessel branching points) related base learners in their top three (Fig. 6b and Extended Data Fig. 4), suggesting that both modes of hypertension may contribute to abnormal vessel-thickness distributions in the retinal vasculature, as well as irregular branching patterns. Nesting number and tree base learners were also recurrent for both models, being selected across all five population-wide control groups for GHTN and four of five population-wide control groups for CHTN, suggesting an irregular structure in the loopiness or redundancy of the vasculature. Furthermore, while the GHTN model gives greater importance to topological data analysis (TDA) flooding, the CHTN model places more weight on TDA outward, indicating that these hypertensive disorders may differ in their vascular organization. Taken together, these differences indicate a simplification of hierarchical vascular organization in GHTN and CHTN, pointing to localized changes, whereas preeclampsia had greater sparsity and disorganization on a global level with the increases in tortuosity and decrease in the number of loops indicating the loss of structural regularity (Figs. 3c and 5). These results align with univariate differences between CHTN and GHTN from population-wide and healthy controls. For example, in both GHTN and CHTN, the mean weighted nesting ratio (a measure of loop asymmetry) was reduced compared to population-wide controls, indicating a simplification of hierarchical vascular organization (Extended Data Fig. 5 and Supplementary Note 3).
Overall, our model demonstrates strong predictive performance for both conditions, supporting the notion that retinal imaging can detect early, subclinical vascular changes in high-risk pregnancies. The differences in retinal topology may reflect the divergent timing, severity or underlying mechanisms of these HDPs.
Discussion
Visionary AI detects retinal vascular signatures of HDPs from ultrawidefield retinal images, enabling prediction well before clinical symptoms emerge. By quantifying early retinal microvascular patterns associated with later diagnosed preeclampsia and related hypertensive disorders, Visionary AI offers a biologically grounded, interpretable and scalable framework for early risk stratification across diverse obstetric populations.
A central advance of this work is the use of graph-based retinal vascular modeling to capture microvascular organization, including topology, vessel geometry, network complexity and hierarchical structure. These representations were predictive in the development cohort and transferred to an independent validation cohort without retraining or optimization using outcome labels. This cross-cohort transfer is particularly important, as the two cohorts differed in population, clinical workflow and imaging-device configuration, providing an initial test of robustness across real-world sources of variation.
Another key advance of Visionary AI is its interpretable framework. The retinal features identified by Visionary AI are biologically plausible in the context of preeclampsia and related hypertensive disorders. Preeclampsia is characterized by systemic endothelial dysfunction, altered vascular tone, antiangiogenic signaling and microvascular injury. The retinal signatures detected here, involving altered vascular topology, branching structure, tortuosity, vessel caliber, loop organization and asymmetry, are consistent with early vascular simplification and reduced network resilience.
These retinal signatures mirror vascular patterns reported in established preeclampsia and other hypertensive states40,45, including reduced vessel density, lower perfusion, diminished branching complexity and increased vascular asymmetry. Because these analyses are based on predictive feature attribution and univariate associations, they should be interpreted as hypothesis generating rather than causal evidence.
Visionary AI captures early signs of vascular simplification, a hallmark of preeclampsia, consistent with two complementary pathological processes: capillary network rarefaction40,45 (loss of small vessels, reduced density and impaired branching complexity) and arteriolar wall thickening (hypertrophic remodeling that narrows luminal diameter and increases resistance)46. These processes jointly contribute to reduced network redundancy, lower perfusion and heightened susceptibility to ischemic injury12,14,47. Our topological metrics, including changes in loop structure, asymmetry and branching organization, are consistent with early deviations in vascular organization and network resilience. Inferior retinal differences in feature importance further align with known variations in regional blood flow48. The fact that Visionary AI identifies these shifts early in gestation underscores the system-wide vascular impairment characteristic of HDPs and provides potential mechanistic insight into disease pathways.
We benchmarked Visionary AI against established clinical risk-stratification approaches and direct image-level deep-learning methods. In the NYU external validation cohort, Visionary AI outperformed the official FMF risk calculator, an established clinical risk prediction tool based on maternal clinical features and pregnancy-related risk factors. We also compared Visionary AI to the clinical risk-stratification approach used at NYU to guide aspirin eligibility at approximately 12 weeks of gestation. This comparison is clinically important because aspirin eligibility reflects the current prevention-oriented workflow; individuals identified as higher risk on the basis of routine obstetric risk factors are recommended low-dose aspirin. Visionary AI achieved higher sensitivity and precision at lower FPRs than aspirin eligibility alone, suggesting that retinal vascular features capture risk information not fully represented by standard clinical criteria. In an additional aspirin-recommended subgroup, Visionary AI maintained strong performance despite enrichment for individuals already identified as higher risk by routine clinical assessment, further supporting its potential to refine risk stratification within clinically high-risk groups. Together, these analyses suggest that Visionary AI provides complementary retinal microvascular information beyond both FMF-based risk estimation and ACOG-recommended aspirin-eligibility criteria.
We also compared Visionary AI to two deep-learning models: RETFound, a retinal foundation model, and Inception-ResNet-v2, a CNN. Both deep-learning approaches performed near chance on the CU development cohort and the independent NYU validation cohort, whereas Visionary AI had strong performance and preserved predictive signal on the external validation cohort. This comparison should be interpreted cautiously, because end-to-end deep-learning models may require substantially larger numbers of outcome events for effective task-specific fine-tuning. Nevertheless, these results support the rationale for Visionary AI’s feature-based design; by converting retinal images into biologically meaningful vascular graph topology, geometry, nesting-tree and organization features, Visionary AI reduces the dimensionality of the prediction problem and may be better suited to limited-event pregnancy cohorts than direct image-level fine-tuning.
Visionary AI offers a fast, noninvasive and cost-effective screening strategy suitable for both high-resource and low-resource settings. Retinal fundus imaging requires no laboratory infrastructure, takes less than 2 min to perform and can be operated by nonspecialists. As our computational pipeline is automated and does not require manual image grading, it eliminates subjectivity and reduces implementation barriers. Visionary AI may provide value as a retinal microvascular adjunct to existing obstetric risk assessment by capturing biological information not fully represented by clinical risk factors, FMF-based prediction or aspirin-eligibility criteria. In practice, this could support earlier and more refined risk stratification, including identification of individuals who may benefit from intensified surveillance, preventive interventions or referral pathways. Additional prospective studies will be needed to determine whether Visionary AI is best deployed as a standalone screening tool, as part of a multimodal model with established clinical and biomarker-based approaches or as a second-line test to refine risk among individuals already classified as clinically high risk. These studies will also be essential to define calibration, optimal operating thresholds, clinical utility, workflow integration and feasibility across diverse healthcare settings.
Several limitations warrant consideration. Although our prospective CU development cohort was large for imaging-based pregnancy research, the absolute number of preeclampsia cases was modest because of low baseline prevalence. The addition of the NYU cohort provides independent external validation across site, population, clinical workflow and imaging-device configuration; however, the validation cohort remains modest in size and has a higher observed preeclampsia prevalence than the annual institutional average. Therefore, we report prevalence-adjusted PPV and NPV but larger prospective validation cohorts will be needed to estimate screening performance, calibration and decision thresholds more precisely across different baseline-risk settings.
Additional limitations include the relatively small number of cases available for subtype-specific analyses, including EOPE and NSF. These analyses were, therefore, treated as post hoc stratified evaluations of a model trained on overall preeclampsia rather than independently trained subtype-specific classifiers. Although the stability-optimized model reduced complexity and transferred to NYU without retraining, the current study remains limited to two US academic medical centers. Importantly, the CU and NYU cohorts already differed in imaging device, acquisition workflow, race and ethnicity distribution and comorbidity profiles, providing an initial test of robustness across these sources of variation. Future studies should extend this validation to larger and more geographically diverse populations, additional healthcare systems, broader baseline-risk settings and lower-cost retinal imaging devices to determine how well the retinal vascular signal transfers across implementation contexts.
Future and ongoing work includes multisite international validation and integration with circulating biomarkers and placental pathology for deeper mechanistic insight. Together, these efforts will determine how Visionary AI can be integrated into early pregnancy care to improve risk stratification and reduce the burden of HDPs.
Methods
Study design, ethics and participants
This prospective study was approved by the Institutional Review Boards of CU and NYU and adhered to the tenets of the Declaration of Helsinki. Informed consent was obtained from every participant before enrollment. The study was designed to evaluate whether retinal vascular features captured during early pregnancy could predict subsequent HDPs. CU served as the development cohort, and NYU served as an independent external validation cohort.
CU development cohort
Pregnant individuals receiving prenatal care at NewYork-Presbyterian/CU Irving Medical Center between 2021 and 2025 were enrolled in the CU development cohort (n = 1,267). Eligible participants were at least 18 years of age, able to provide informed consent and could be enrolled through the second trimester of pregnancy.
Maternal demographic and clinical data were extracted from the electronic health record, including age, race, ethnicity, obstetric history, medical history, medication exposures, laboratory values and pregnancy-related diagnoses (that is, gestational diabetes mellitus and HDPs). Delivery outcomes were also recorded, including birth weight, small for gestational age, severe small for gestational age, stillbirth and Apgar scores.
Retinal images were obtained from each eye by trained research technicians using the Optos ultrawidefield Primary scanning laser ophthalmoscope, which captures 200° images covering approximately 80% of the retina. Images were acquired during first-trimester, second-trimester and third-trimester study visits when available. Because the primary objective was early prediction before clinical diagnosis, CU model development analyses used first-trimester images when available. For participants without first-trimester imaging, second-trimester images obtained before 20 weeks of gestation were used. History of ocular conditions and prior ocular surgery was captured and used to determine imaging-related exclusions as described below.
NYU external validation cohort
Pregnant individuals receiving prenatal care at the Mignone Women’s Health Collaborative at NYU Langone Health between 2025 and 2026 were enrolled in the NYU external validation cohort (n = 79). Eligible participants were at least 18 years of age and able to provide informed consent. Maternal demographic, clinical and pregnancy-outcome data were extracted from the electronic health record using the same general categories as in the CU cohort.
Retinal images were obtained from each eye by trained research technicians using the Optos ultrawidefield California scanning laser ophthalmoscope, which also captures 200° images covering approximately 80% of the retina. The NYU cohort differed from the CU cohort in clinical workflow, imaging-device configuration, race and ethnicity distribution and comorbidity profile. For the external validation analysis, only retinal images acquired during the first trimester, until 13 weeks of gestation were used. Thus, the NYU validation analysis provided an early-pregnancy external test of the CU-trained model under a different site, population, imaging workflow and device configuration.
Extended Data Tables 1 and 2 summarize demographic, clinical and pregnancy-outcome characteristics for the CU and NYU cohorts.
Clinical outcomes and case definitions
In both cohorts, HDPs were diagnosed by participants’ obstetric clinicians during routine prenatal care and extracted from the electronic health record. Preeclampsia was defined according to the 2013 American College of Obstetricians and Gynecologists criteria8. GHTN was defined as new-onset hypertension after 20 weeks of gestation without diagnostic criteria for preeclampsia. CHTN was defined as hypertension present before pregnancy or diagnosed before 20 weeks of gestation.
Preeclampsia cases were further classified by disease severity and timing of onset. SF was defined as preeclampsia accompanied by at least one severe clinical feature, including severe-range BP (systolic BP ≥ 160 mmHg or diastolic BP ≥ 110 mmHg on two occasions more than 4 h apart), thrombocytopenia, impaired liver function, renal insufficiency, pulmonary edema or new-onset neurologic symptoms8. NSF met diagnostic criteria for preeclampsia but did not meet criteria for severe features (systolic BP ≥ 140 mmHg or diastolic BP ≥ 90 mmHg on two occasions that were at least 4 h apart, accompanied by either proteinuria or mild signs of maternal organ dysfunction)8. EOPE was defined as symptoms at or before 34 weeks of gestation and LOPE was defined as symptoms after 34 weeks of gestation.
In the CU development cohort, 55 participants were diagnosed with preeclampsia (corresponding to 4.3% observed preeclampsia prevalence), including 38 with severe features and 17 without severe features. In total, 20 cases were classified as EOPE and 35 were classified as LOPE. All CU preeclampsia cases were independently reviewed by a maternal–fetal medicine specialist who were masked to retinal imaging results. One CU participant with preeclampsia was excluded from retinal-model analyses because of poor retinal image quality; therefore, retinal-model analyses included 54 CU preeclampsia cases where indicated.
In the NYU external validation cohort, 14 participants were diagnosed with preeclampsia, corresponding to an observed validation cohort preeclampsia prevalence of approximately 17.7%. Preeclampsia cases included nine with severe features and five without severe features; one case was classified as EOPE and 13 cases were classified as LOPE. All NYU preeclampsia cases were independently reviewed by a maternal–fetal medicine specialist who was masked to retinal imaging results. One NYU participant with preeclampsia was excluded from the retinal-model evaluation analyses because of poor retinal image quality; therefore, retinal-model analyses included 13 preeclampsia cases were indicated.
Birth outcomes were extracted from the electronic health record, including gestational age at delivery, birth weight, small for gestational age, severe small for gestational age, stillbirth and Apgar scores. Small for gestational age was defined as birth weight below the tenth percentile for gestational age and severe small for gestational age was defined as birth weight below the third percentile.
Retinal image acquisition and preprocessing
Ultrawidefield retinal images were acquired by trained research technicians at each study site. In the CU development cohort, images were acquired using the Optos ultrawidefield Primary scanning laser ophthalmoscope. In the NYU external validation cohort, images were acquired using the Optos ultrawidefield California scanning laser ophthalmoscope. Both systems capture 200° retinal images covering approximately 80% of the retina. After image-level preprocessing and quality control, the analytic retinal image dataset included 4,361 images in the CU and NYU cohorts.
For the CU development analyses, retinal images acquired during the first trimester were used when available. For participants without first-trimester imaging, second-trimester images obtained before 20 weeks of gestation were used. This approach was selected to maximize early-pregnancy sample size while preserving the presymptomatic prediction framework. In contrast, the NYU external validation analysis was restricted to retinal images acquired until 13 weeks of gestation, only during the first trimester.
Artifact mitigation began at image acquisition. During clinical imaging, imagers were instructed to acquire multiple images when eyelashes, eyelids, shadows, positioning differences or other localized artifacts were observed. This multi-image acquisition strategy allowed vascular regions obscured in one image to be recovered from another image of the same eye during VSI generation and merging, reducing sensitivity to localized artifacts and limiting reliance on manual exclusion of lower-quality images.
Before vessel segmentation, retinal images were standardized to support consistent downstream processing. Each image was then cropped using a standardized elliptical mask to remove nonretinal regions and peripheral artifacts outside the retinal field of view, including eyelashes, eyelids and acquisition-related obstructions. This preprocessing step was applied programmatically and uniformly across images before AI-based vessel segmentation. The elliptical mask was 3,904 × 3,008 pixels and captured approximately 50% of the image where the majority of the retinal vasculature is captured. Images were rescaled to a uniform zoom level and resized to 912 × 912 pixels.
Images with inadequate quality for vessel segmentation or downstream feature extraction were excluded according to prespecified quality-control procedures described below. History of ocular conditions or prior ocular surgery was also captured and used to guide image-level or participant-level exclusions where relevant.
AI-based vessel segmentation and VSI generation
Preprocessed ultrawidefield retinal images were converted into VSIs using a dedicated retinal vessel segmentation AI model developed for this study. VSIs provide binary representations of the retinal vascular tree and serve as the input for downstream vascular feature extraction.
The segmentation model was inspired by retinal vessel generative adversarial network (RV-GAN) architectures and used a U-Net-based generator designed to capture both large-scale vascular structure and fine vessel detail49. The RV-GAN model was initially trained using publicly available 45° color fundus-image datasets paired with expert-annotated vessel segmentation maps50,51,52,53,54. It was then fine-tuned on a curated set of 20 ultrawidefield retinal images from the study cohort with corresponding hand-annotated vessel maps. These ultrawidefield vessel maps were reviewed by a retinal specialist to ensure anatomical plausibility and segmentation quality.
The segmentation model generated vessel-probability maps, in which each pixel was assigned a probability of representing retinal vasculature. Probability maps were binarized using a threshold of 0.3 to preserve fine vascular detail and small disconnected components were removed during postprocessing. The resulting VSIs were used for downstream VSI merging and feature extraction.
When multiple images were available from the same eye, VSIs were merged to generate a more complete representation of the retinal vasculature and to recover regions obscured by localized artifacts in individual images (Extended Data Fig. 6). VSI merging was performed sequentially at the eye level. First, oriented fast rotated BRIEF (ORB) keypoint detection and descriptor matching were used to identify corresponding vascular structures across VSIs. A homography transformation was then estimated using random sample consensus to achieve coarse alignment while reducing the influence of mismatched keypoints. Next, a gradient-descent image-registration algorithm was used to identify the local transformation that maximized vessel overlap between the two VSIs being merged. This deformable registration step locally adjusted the images to account for nonlinear differences in image acquisition and retinal geometry. When more than two VSIs were available for the same eye, images were merged sequentially according to acquisition order.
After eye-level VSI generation, vascular features were extracted independently from the right and left eyes and when both were available averaged to generate participant-level feature values. One-eye imaging data were retained when image quality was sufficient for vessel segmentation and downstream feature extraction. In the CU cohort, 29 subjects only had data for one eye, while two subjects had data for only one eye in the NYU cohort.
Image and VSI quality control and analytic image or VSI exclusions
Image and VSI quality were evaluated using three complementary metrics designed to capture vascular completeness and common acquisition artifacts: vessel-density score, eyelash score and artifact score (Supplementary Fig. 12 and Supplementary Note 4). These metrics were used to assess whether retinal images and derived VSIs were suitable for downstream vascular feature extraction and model evaluation.
The vessel-density score was calculated from each VSI to quantify the spatial completeness of the detected retinal vasculature. Each VSI was divided into a 12 × 12 grid and the proportion of grid squares containing vessel pixels above a prespecified threshold was calculated. A grid square was considered vessel-containing if vessel pixels exceeded 1% of the square. This score captured incomplete vascular coverage that could arise from poor image quality, obstruction or segmentation failure.
The eyelash score was generated using an ordinal image-quality classifier trained to identify eyelash obstruction in fundus images. Images were assigned an ordinal score corresponding to no, mild, moderate or severe eyelash obstruction. This metric was used to quantify localized obscuration that could affect vessel visibility and downstream feature extraction.
The artifact score was generated using a binary classifier trained to identify acquisition-related artifacts, including machine artifacts, shadows, eyelids and other image-quality defects that could interfere with segmentation or vascular feature extraction. Images assigned high artifact burden were reviewed according to prespecified quality-control criteria.
Quality-control metrics were evaluated at the image, eye and participant levels.
When multiple images were available for the same eye, localized artifacts in individual images were mitigated through VSI merging, as described above. Images or participant-level vascular representations were excluded from retinal-model analyses only when image quality was insufficient for reliable vessel segmentation or downstream feature extraction, according to prespecified segmentation quality criteria. These criteria included sparse vessel segmentation, defined by a vessel-density score < 0.25, and additional segmentation quality failures, described in Supplementary Note 5. Participants were excluded only when adequate vascular representations could not be obtained from either eye. Using these criteria, four participants were excluded from the performance-optimized CU analysis, six from the stability-optimized CU analysis with expanded controls and 13 from the NYU cohort. Sensitivity analyses evaluating robustness to image-quality variation and single-eye availability are described under model evaluation procedures, with detailed results provided in Supplementary Note 5.
Retinal vascular feature generation
Retinal vascular features were generated from participant-level VSIs. Feature extraction was designed to quantify complementary dimensions of retinal microvascular architecture, including graph topology, vessel geometry, vascular complexity and spatial organization and hierarchical loop structure (nesting tree). Detailed feature definitions are provided in Supplementary Note 1.
VSIs were first converted into graph-based representations of the retinal vascular tree. Binary vessel maps were skeletonized and nodes were assigned to vessel bifurcations and terminal points. Edges represented vessel segments connecting adjacent nodes. From these graphs, we extracted features describing branching architecture and network connectivity, including numbers of nodes, bifurcation points, terminal points, connected components, internode distances and topological length. Topological length was calculated as a graph-based measure of hierarchical vessel depth, with both weighted and unweighted versions computed, and was evaluated separately in superior, inferior and whole-retina regions when applicable.
Geometric features were extracted to quantify vessel shape, caliber and curvature. These included vessel-length and vessel-density measures, vessel-thickness features and multiple tortuosity measures. Tortuosity features summarized deviations from a straight vessel path using complementary metrics, including sinuosity, inflection-based tortuosity, curvature-based tortuosity and tortuosity density.
To capture higher-order vascular complexity and spatial organization, we extracted box-counting, fractal and TDA features. Box-counting features quantified how retinal vessels occupied space across scales and dimensionality of high-dimensional box-counting outputs was reduced using principal component analysis before model training. TDA was used to quantify connected components and loops across multiple filtrations, including radial and distance-based filtrations. Persistence diagrams were converted into vectorized representations suitable for downstream predictive modeling, with principal component analysis used where appropriate to reduce dimensionality.
We also extracted nesting-tree features to quantify the hierarchical organization of vascular loops and bifurcations. These features summarized loop count, loop organization, asymmetry and redundancy of the vascular network, providing complementary information about network resilience and hierarchical structure.
For selected feature classes, distributional-shift features were calculated by comparing each participant’s empirical feature distribution to distributions observed in healthy controls using two-sample Kolmogorov–Smirnov statistics. These distributional features were calculated within the cross-validation framework to prevent information leakage; when a healthy control served as the held-out participant, that participant was excluded from the reference set used to construct training features.
Extracted features were grouped into 32 semantically related feature sets spanning graph topology, geometry, complexity and organization, nesting-tree structure and mixed feature categories. These feature sets served as inputs to independent base learners in the Visionary AI model architecture described below.
Visionary AI model architecture
Visionary AI was designed as a stacked ensemble framework that integrates multiple biologically defined retinal vascular feature sets into a participant-level risk prediction. The model architecture consisted of two levels: feature-set-specific base learners and a metalearner that aggregated base-learner predictions.
Each of the 32 retinal vascular feature sets described above was used to train independent base learners. For each feature set, we evaluated three model classes: logistic regression (LR), random forest (RF) and extreme gradient boosting (XGB). This generated an initial candidate space of 96 retinal vascular base learners. Each base learner was trained on a single semantically defined feature set, allowing model predictions to remain interpretable at the level of vascular feature sets.
Throughout the retinal-model analyses, we included two minimal obstetric-history adjustment variables: first pregnancy and prior preeclampsia history (Supplementary Table 7). These variables were included to account for key pregnancy-history context while preserving the primary retinal vascular focus of the model. No broader clinical risk model was included in the primary Visionary AI architecture (Supplementary Note 6).
Base-learner predictions were integrated using a stacked generalization framework. In the CU development cohort, LOOCV was used to generate out-of-fold predictions for each participant. For each fold, base learners were trained on all participants except the held-out participant and predictions for the held-out participant were stored as out-of-fold base-learner predictions. These out-of-fold predictions were then used as inputs to an XGB metalearner, which generated the final participant-level risk prediction.
RFE was used within the metalearner framework to select a subset of informative base learners and reduce redundancy across correlated vascular representations. This approach allowed Visionary AI to integrate complementary vascular signals while limiting reliance on an unnecessarily large ensemble. All model fitting, base-learner prediction generation, metalearner training and feature-selection steps were performed within the appropriate training folds to mitigate overfitting.
For participants with features available from both eyes, right-eye and left-eye feature values were averaged before model training to generate a participant-level retinal vascular representation. Intereye differences may arise from biological asymmetry, acquisition variability, eyelash or eyelid obstruction, localized artifacts or segmentation incompleteness. Bilateral averaging was, therefore, used to reduce sensitivity to any single-eye artifact or local segmentation error and to better capture systemic retinal vascular architecture. When only one eye was available after quality control, the available eye was used. Final model outputs were participant-level.
Model development and evaluation settings
Visionary AI was evaluated across a series of increasingly stringent model development and validation settings. These included a high-contrast CU analysis comparing preeclampsia cases to narrowly defined healthy controls, a performance-optimized CU population-wide analysis, a stability-optimized CU model designed to prioritize reproducibility across control definitions and an independent NYU external validation analysis performed without retraining or optimization using NYU outcome labels.
High-contrast CU analysis
The high-contrast CU analysis was designed to determine whether retinal vascular features captured early in pregnancy contained detectable signal associated with subsequent preeclampsia. In this setting, preeclampsia cases were compared to a narrowly defined healthy-control group selected to minimize medical, ocular, medication-related and pregnancy-related conditions that could independently influence retinal vascular structure (n = 136, 54 cases and 82 healthy controls).
Healthy controls were drawn from singleton pregnancies without documented preexisting maternal comorbidities, ocular conditions, relevant medication exposures or pregnancy complications. Exclusion criteria included cardiometabolic, neurologic, vascular, hematologic, endocrine, infectious or genetic diseases, prior ocular surgery or trauma, multifetal gestation, use of medications that could reflect or modify vascular risk, including antihypertensive agents, insulin or aspirin, and pregnancy complications, including hypertensive disorders, gestational diabetes, cholestasis, hyperemesis, stillbirth, multifetal gestation or smoking-related exposures. From the eligible healthy-control pool, a subset of 82 controls was selected to support class balance and approximate matching on key demographic and imaging variables.
Performance-optimized CU population-wide analysis
To evaluate model performance in a more clinically heterogeneous obstetric population, we performed a population-wide CU analysis in which preeclampsia cases were compared to broader nonpreeclampsia controls from the CU cohort (preeclampsia: n = 1,137, including 54 preeclampsia cases, 82 healthy controls and 1,001 population-wide controls; GHTN: n = 1,132, including 49 GHTN cases, 82 healthy controls and 1,001 population-wide controls; CHTN: n = 1,106, including 61 CHTN cases, 82 healthy controls and 963 population-wide controls). Unlike the high-contrast analysis, the population-wide control pool retained participants with common clinical comorbidities, including CHTN, diabetes and obesity, to better reflect the heterogeneity encountered in prenatal care.
Exclusions from the population-wide control pool were limited to prespecified conditions that could confound outcome definition or preclude valid retinal-model evaluation, including multifetal gestation, HELLP syndrome, other maternal hypertensive disorders, stillbirth and unavailable or low-quality retinal images. For both preeclampsia and GHTN, CHTN cases were not excluded from the control set. For GHTN, preeclampsia cases were excluded and not considered as controls. For CHTN, both GHTN and preeclampsia cases were excluded and not considered as controls. For the performance-optimized model, repeated sampled control sets were generated from the broader population-wide control pool and the selected healthy controls were included in each sampled evaluation set. Specifically, each population-wide ensemble model was trained and evaluated using the 54 preeclampsia cases, the 82 selected healthy controls and one of ten randomly sampled population-wide noncase sets, each containing at least 100 controls sampled without replacement from the broader population-wide control pool. Performance metrics were aggregated across repeated population-wide control samplings. Because these sampled evaluation sets did not reflect the full underlying CU preeclampsia prevalence, PPV and PR metrics calculated directly from the sampled sets were interpreted as sampled evaluation metrics rather than real-world screening estimates. Prevalence-adjusted PPV and NPV were, therefore, calculated separately as described below.
The performance-optimized model used the stacked ensemble architecture described above to integrate base learners trained on complementary retinal vascular feature sets. Base learners were constructed by training LR, RF and XGB classifiers on each feature set. Hyperparameters were tuned using LOOCV, with the best combination selected on the basis of F1 score. The LR grid included penalty {L1, L2}, C {0.01, 0.1, 1.0, 10} and solver {saga}. The RF grid included number of estimators {100, 200}, max depth {1, 3, none}, minimum samples per leaf {1, 2}, minimum samples per split {2, 5} and max features {sqrt, 0.5, none}. The XGB grid included number of estimators {100, 250}, max depth {1, 2, 3}, learning rate {0.01, 0.1, 0.3}, subsample {0.8, 1.0} and scale-positive weight {2, 8, 12}. Base learners with AUC ≤ 0.5 were excluded from metalearner consideration.
Out-of-fold predictions from retained base learners were used to train an XGB metalearner. Metalearner hyperparameters were tuned using LOOCV to prioritize F1 score. The metalearner grid included number of estimators {100, 250}, max depth {1, 2, 3}, learning rate {0.01, 0.1, 0.3}, subsample {0.8, 1.0}, scale-positive weight {2, 8, 12} and number of base learners selected by recursive feature elimination (RFE) {8, 16, 32}. RFE was used to select a subset of informative base learners and reduce redundancy among correlated retinal vascular representations. For GHTN, the learning rate was limited to 0.01 and the same base-learner parameters were selected for all metalearners on the basis of average performance.
Stability-optimized CU model
To reduce model complexity and prioritize reproducible retinal vascular signal, we developed a stability-optimized CU model (preeclampsia: n = 1,188, including 54 preeclampsia cases and 1,134 population-wide controls; GHTN: n = 1,138, including 49 GHTN cases and 1,089 population-wide controls; CHTN: n = 1,143, including 61 CHTN cases and 1,082 population-wide controls). For the stability-optimized model, control exclusion criteria were similar to those used for the performance-optimized model, with one modification intended to better reflect the clinical heterogeneity of routine obstetric care. Specifically, participants with HDPs (for example, GHTN) that were not diagnosed with preeclampsia, were retained in the control set. Thus, for GHTN and CHTN, preeclampsia was excluded from their control sets but GHTN was included in the preeclampsia and CHTN control set. This design allowed the stability-optimized preeclampsia model to be evaluated against a broader and more clinically realistic spectrum of nonpreeclampsia pregnancies. This model was designed to favor consistency across nonoverlapping population-wide control settings rather than maximal performance in a single site configuration.
For this analysis, repeated use of the same healthy controls across control settings was removed. Each healthy control was included only once, together with an expanded population-wide control pool, and the resulting controls were divided into five nonoverlapping population-wide control settings.
To construct the five population-wide groups, we partitioned eligible controls into five mutually exclusive sets—PW1 through PW5—with similar distributions of prespecified clinical characteristics and image-quality measures. We first identified all healthy controls, as defined above, and divided them into five equally sized groups. We then grouped the remaining controls according to shared profiles across the following characteristics: history of preeclampsia, GHTN or gestational diabetes, multigravidity, obesity, advanced maternal age, gestational anemia, IVF, cardiac disease, history of hypertension and eyelash and artifact ranks derived from the image-quality models described below. Participants with the same profile across these characteristics were initially assigned to the same stratum. Strata with fewer than five participants were merged with the most similar stratum on the basis of the Hamming distance between their binarized characteristic profiles. The controls were then allocated across PW1–PW5 on the basis of the resulting strata. This procedure produced more consistent distributions of key clinical and image-quality characteristics across the five population-wide control groups.
Candidate base learners and hyperparameter configurations were evaluated across these population-wide settings. Hyperparameter configurations were selected on the basis of low variability in AP and high minimum AUC across control settings, thereby prioritizing base learners with consistent performance across population definitions.
Specifically, the base-learner search space consisted of 96 candidate base learners representing 32 retinal vascular feature sets and three model types: LR, RF and XGB. LOOCV was used to train base learners within each of the five CU population-wide control groups. The LR grid included penalty {L1, L2}, C {0.01, 0.1, 1.0, 10} and solver {saga}. The RF grid included number of estimators {100, 200}, max depth {1, 3, none}, minimum samples per leaf {1, 2}, minimum samples per split {2, 5} and max features {sqrt, 0.5, none}. The XGB grid included number of estimators {100, 250}, max depth {1, 2, 3}, learning rate {0.01, 0.1, 0.3}, subsample {0.8, 1.0} and scale-positive weight {4, 5, 6}.
Performance of each base learner and hyperparameter combination was calculated within each population-wide control group using AUC and AP. Hyperparameter combinations with all zero feature importance or coefficients for at least one control group were excluded. For each base learner, hyperparameter combinations were then summarized across the five control groups by calculating the minimum AUC and the s.d. of AP. Hyperparameter combinations were filtered to retain those with AP s.d. below the 25th percentile for that base learner (Supplementary Fig. 1). Among the remaining combinations, the configuration with the highest minimum AUC was selected as the stability-optimized hyperparameter configuration. Base learners were retained for metalearner training only if the minimum AUC of the stability-selected configuration exceeded 0.5 (Extended Data Fig. 2).
During metalearner training, out-of-fold probabilities from retained base learners were used for hyperparameter tuning and RFE. The XGB metalearner grid included number of estimators {100, 250}, max depth {1, 2, 3}, learning rate {0.01, 0.1, 0.3}, subsample {0.8, 1.0}, scale-positive weight {2, 8, 12} and number of base learners selected by RFE {8, 16, 32}. The number of retained base learners was tuned during metalearner training and used to perform RFE, thereby limiting model complexity and removing redundant base learners.
For preeclampsia, the highest AUC achieved during metalearner hyperparameter tuning across all five population-wide control groups used eight selected base learners. Because different LOOCV folds could select different sets of eight base learners, final model construction required an additional deduplication step. For each population-wide control group, we considered the union of base learners selected across LOOCV folds and selected the final eight base learners on the basis of the average metalearner base-learner importance, while disallowing base learners trained on repeated feature sets to reduce collinearity and correlated signal amplification. For GHTN and CHTN, some population-wide control groups selected more than eight base learners; in these cases, up to the number of base learners selected during hyperparameter tuning were retained, depending on the number remaining after feature-set deduplication.
These steps ensured that the final stability-optimized model used for validation was substantially more constrained than the initial candidate search space and retained base learners reflected recurrent retinal vascular representations across the five population-wide control groups. The resulting stability-optimized CU model was used for external validation.
NYU external validation
The stability-optimized CU model was evaluated in the independent NYU validation cohort without retraining, refitting, feature reselection or hyperparameter optimization using NYU outcome labels. The CU-derived model architecture selected base learners, hyperparameters and learned retinal vascular representations were preserved. NYU validation was restricted to retinal images acquired up until 13 weeks of gestation, only during the first trimester.
Unlike the CU population-wide analyses, the NYU validation analysis did not rely on repeated or balanced and sampled control sets. Cases and controls in the NYU analytic validation cohort were evaluated together at their observed prevalence. Because the observed preeclampsia prevalence in the NYU validation cohort was higher than the annual institutional preeclampsia prevalence at NYU Langone Health, PPV and NPV were reported both at the observed validation cohort prevalence and after adjustment to the institutional annual prevalence estimate.
To reduce site-associated and device-associated feature-scale differences before applying the CU-trained model to NYU, we applied a prespecified robust feature distribution harmonization procedure to the NYU features. This preprocessing step was applied uniformly to all NYU validation samples and did not use individual-level NYU outcome labels or perform model fitting, feature selection, hyperparameter tuning or threshold optimization on the NYU data. CU reference distributions were constructed by repeatedly sampling CU controls without replacement and combining them with CU preeclampsia cases to match the aggregate case fraction of the NYU validation cohort. For each feature, the median and interquartile range (IQR) were calculated within and averaged across each CU reference set. NYU features were then robustly rescaled by centering the distribution (that is, subtracting the NYU median), dividing by the NYU IQR, multiplying by the corresponding CU reference IQR and shifting by the CU reference median. Medians and IQRs were used rather than means and s.d. to reduce sensitivity to outliers. Because this harmonization used only aggregate validation cohort composition and did not use individual-level NYU outcome labels or NYU labels for any model-fitting decision, we treat it as a feature distribution preprocessing step rather than as model retraining, threshold optimization or probability calibration.
Preeclampsia subtype analyses
Preeclampsia subtype analyses were performed as post hoc stratified evaluations of models trained on overall preeclampsia. The model was not retrained separately for SF, NSF, EOPE or LOPE. For each subtype, model predictions from the overall preeclampsia model were evaluated among participants belonging to the corresponding subtype group. These analyses were used to assess whether the overall preeclampsia model retained predictive signal across clinically heterogeneous preeclampsia presentations.
Differential-diagnosis analyses
To assess whether Visionary AI distinguished preeclampsia from related HDPs, differential-diagnosis analyses compared preeclampsia cases with participants diagnosed with other hypertensive disorders, including GHTN and CHTN. These analyses were intended to evaluate whether the preeclampsia-associated retinal vascular signal was separable from retinal vascular patterns associated with other hypertensive pregnancy phenotypes.
Subgroup analyses
Subgroup analyses were conducted to evaluate model behavior across demographic and clinical risk factor strata when sample sizes permitted. Subgroups included race and ethnicity categories, obesity status, CHTN and other clinically relevant risk factor groups available in the electronic health record. These analyses were interpreted descriptively because several strata contained limited numbers of preeclampsia cases.
Sensitivity and robustness analyses
Sensitivity and robustness analyses were conducted to evaluate whether model performance depended on image quality, eye availability or segmentation quality. Image-quality sensitivity analyses considered vessel-density, eyelash and artifact scores. Technical details for image-quality metrics, vessel segmentation and VSI generation are provided above and in Supplementary Note 4; model evaluation sensitivity analyses were interpreted as robustness checks rather than independent validation cohorts.
To evaluate whether model performance depended on bilateral feature averaging, we performed a single-eye sensitivity analysis using the final Visionary AI model. Rather than averaging features across both eyes, we selected one eye per participant and generated predictions using single-eye feature summaries. To assess whether single-eye performance was influenced by image quality, eye selection was based on the vessel-density score. Specifically, we evaluated model performance when selecting, for each participant, either the eye with the highest or lowest vessel-density score, eyelash score and artifact score. This analysis tested whether prediction was robust to single-eye selection and whether performance was disproportionately affected by eyes with lower vascular density or less complete vascular coverage.
Bootstrap resampling analysis
To quantify uncertainty in model performance, we performed participant-level stratified bootstrap resampling of the NYU external validation cohort. In each of 10,000 replicates, cases and controls were sampled separately with replacement, preserving the original cohort size and case–control distribution: 13 cases and 53 controls in the analytic NYU cohort and eight cases and 25 controls in the aspirin-recommended subgroup. All images from a participant were retained together within each replicate and image-level predictions were aggregated to the participant level before metric calculation. We calculated AUC, AP and threshold-based performance metrics for each replicate and derived nonparametric 95% confidence intervals from the 2.5th and 97.5th percentiles of the resulting bootstrap distributions. For threshold-based analyses, the model-specific operating thresholds were prespecified on the basis of clinical considerations, targeting a FPR of no more than 10%, and were fixed before evaluation of the NYU cohort. These thresholds were applied unchanged in every bootstrap replicate (Supplementary Note 7).
Clinical benchmarking analyses
Visionary AI was benchmarked against established clinical risk-stratification approaches for preeclampsia, including the FMF risk calculator and aspirin-eligibility criteria used in routine prenatal care. These analyses were designed to evaluate whether retinal vascular features provided predictive information beyond clinical risk factors and pregnancy-history variables.
FMF risk calculator
The official FMF27 first-trimester risk calculator portal was used to estimate preeclampsia risk from maternal demographic, clinical and obstetric-history variables. The NYU cohort provided the most complete FMF comparison because all required maternal demographic, clinical and family-history variables were available from the electronic health record. These included maternal age, height, weight, racial origin, CHTN, type 1 diabetes, smoking status, systemic lupus erythematosus, method of conception, obstetric history and family history of preeclampsia.
FMF risk estimates were also generated for the CU cohort when available variables permitted. In the CU cohort, major maternal demographic and clinical-history variables were available but family history of preeclampsia, height, weight and a direct systemic lupus erythematosus variable were not available. When applicable, rheumatologic disease was used as a proxy for systemic lupus erythematosus. Because of these missing or proxy variables, CU FMF comparisons were treated as secondary benchmarking analyses and interpreted with caution.
FMF-derived probabilities were compared to Visionary AI predictions in the CU performance-optimized analysis, CU stability-optimized analysis and NYU external validation cohort. In addition, we evaluated a combined Visionary AI + FMF model in which Visionary AI predictions and FMF probabilities were integrated into a final prediction model. This analysis was used to assess whether FMF-derived clinical risk estimates added predictive information beyond the retinal vascular signal captured by Visionary AI.
NYU aspirin-eligibility benchmark
We also compared Visionary AI to the clinical risk-stratification approach used at NYU and CU to guide aspirin eligibility at approximately 12 weeks of gestation. Aspirin eligibility was abstracted from the electronic health record and reflected routine prenatal-care decision making on the basis of clinical risk factors, including IVF, maternal age over 35 years, BMI over 30 and other clinician-assessed risk factors used in standard obstetric care according to ACOG guidelines. Aspirin eligibility was treated as a binary clinical benchmark and compared to Visionary AI using threshold-based operating characteristics, including FPR, TPR, PPV and NPV.
Aspirin-recommended subgroup analysis
As an additional sensitivity analysis, we evaluated Visionary AI within the subgroup of NYU participants who were recommended aspirin during pregnancy. This subgroup represented a clinically enriched population expected to have elevated baseline risk on the basis of routine obstetric assessment. The stability-optimized CU model was applied to this subgroup without retraining or optimization using NYU outcome labels. Performance within the aspirin-recommended subgroup was compared to FMF-derived risk estimates to assess whether retinal vascular features retained predictive signal among individuals already identified as higher risk by clinical criteria.
Prevalence-adjusted PPV and NPV
Because PPV and NPV depend on outcome prevalence, threshold-based predictive values were interpreted in the context of each evaluation setting. In CU population-wide analyses, repeated sampled control sets were used and did not reflect the full underlying CU preeclampsia prevalence. Therefore, PPV and NPV estimated directly from sampled CU evaluation sets were not interpreted as real-world screening estimates. Prevalence-adjusted PPV and NPV were calculated using the observed CU preeclampsia prevalence of 4%.
In the NYU external validation cohort, cases and controls were evaluated together without repeated or balanced control sampling. However, the observed preeclampsia prevalence in the analytic NYU validation cohort was higher than the annual institutional preeclampsia prevalence at NYU Langone Health. Therefore, NYU threshold-based PPV and NPV were reported both at the observed validation cohort prevalence and after adjustment to the institutional annual prevalence estimate of 8%.
For prevalence adjustment, PPV and NPV were calculated from sensitivity, specificity, and the target prevalence using standard diagnostic-test formulas:
$$mathrm{PPV}=,frac{mathrm{Sensitivity},times ,mathrm{Prevalence}}{mathrm{Sensitivity},times ,mathrm{Prevalence}+left(1-mathrm{Specificity}right)times (1-mathrm{Prevalence})}$$
$$mathrm{NPV}=,frac{mathrm{Specificity},times ,(1-mathrm{Prevalence})}{left(1-mathrm{Sensitivity}right)times ,mathrm{Prevalence}+mathrm{Specificity},times ,(1-mathrm{Prevalence})}$$
$$mathrm{FPR},=,1,-,mathrm{Specificity}$$
$$mathrm{TPR},=,mathrm{Sensitivity}$$
These prevalence-adjusted estimates were used to provide clinically contextualized screening performance estimates across baseline-risk settings.
RETFound and Inception-ResNet-v2 deep-learning benchmarks
To benchmark Visionary AI against direct image-level deep-learning approaches, we compared its performance to RETFound, a retinal foundation model, and Inception-ResNet-v2, a CNN model. Both models were trained and evaluated in the CU development cohort using participant-level LOOCV. In each LOOCV iteration, all retinal images from the held-out participant were excluded from model training, preprocessing decisions and model selection.
RETFound was initialized with publicly available pretrained weights and fine-tuned for preeclampsia prediction for up to 25 epochs using the developers’ publicly available scripts and default fine-tuning parameters. The model generated image-level probabilities, which were averaged across all available images from each participant to obtain participant-level predictions.
Inception-ResNet-v2 was evaluated as a transfer-learning CNN baseline and trained for up to 25 epochs. All layers were frozen except the final classification layer; thus, a new classification head was trained on fixed pretrained image representations without end-to-end fine-tuning of the convolutional backbone. Training used a weighted cross-entropy loss, with weights of 1 for controls and 4 for cases, reflecting the approximately 20% case prevalence in each combined population-wide training set. Image-level probabilities were averaged across all available images from each participant to obtain participant-level predictions.
For external evaluation, the CU-trained RETFound and Inception-ResNet-v2 models were applied to the independent NYU cohort without using NYU outcomes for model fitting, fine-tuning, preprocessing or model selection decisions, hyperparameter or epoch selection and calibration.
Feature-importance and interpretability analyses
Feature-importance analyses were performed to identify the retinal vascular representations contributing to Visionary AI predictions. Importance was evaluated at multiple levels of the stacked ensemble: individual features within base learners, base learners within the metalearner and aggregations of base learners into broader vascular feature categories.
Feature importance was extracted directly from RF and XGB models. For LR base learners, the absolute value of the model coefficients was used as the feature-importance measure. Feature-importance values were normalized within each model before aggregation. To aggregate importance across leave-one-out folds, normalized feature-importance values were averaged across folds; features or base learners not selected in a given fold were assigned an importance of zero for that fold.
For base learners, feature importance quantified the contribution of each vascular trait in a feature set. Similarly, metalearner importance was calculated from the trained metalearner to quantify the contribution of each base learner to the final participant-level prediction. For the importance heat maps, the base-learner importance was calculated by aggregating the importance of base learners trained on the same vascular feature set across model classes (LR, XGB and RF). Category-level importance was calculated by aggregating base-learner importance across broader retinal vascular categories, including graph topology, geometry, complexity and organization, nesting-tree features and mixed features.
For the stability-optimized model, feature-importance consistency was evaluated across leave-one-out folds and across nonoverlapping population-wide control settings. Recurrent base learners and feature categories were identified by examining which were repeatedly selected and assigned high importance across control settings. These analyses were used to assess whether model predictions were driven by stable retinal vascular representations rather than fold-specific or control-set-specific feature-selection artifacts.
Univariate vascular feature analyses
Univariate analyses were performed to characterize individual retinal vascular features associated with preeclampsia and related HDPs. These analyses were used for biological interpretation and hypothesis generation, not the primary basis for predictive performance claims, which were based on the multivariate Visionary AI models and independent validation analyses.
For each selected vascular feature, distributions were compared between cases and control groups using nonparametric statistical tests. Mann–Whitney U-tests were used to evaluate differences in feature distributions between groups, with emphasis on differences in central tendency. Kolmogorov–Smirnov tests were used to evaluate broader distributional differences between groups, including differences in shape, spread or cumulative distribution patterns.
For features represented as subject-level summaries, we also calculated effect-size measures where applicable, including odds ratios and fold-change risk ratios. LR models were used to estimate the association between individual vascular features and outcome status when appropriate. These analyses were performed for comparisons between preeclampsia cases and healthy controls, between preeclampsia cases and population-wide controls and, where sample size permitted, across preeclampsia subtypes and other HDPs.
Because many vascular features and disease comparisons were evaluated, Benjamini–Hochberg false discovery rate (FDR) correction was applied to the univariate vascular feature analyses. Both nominal P values and FDR-adjusted P values were reported where applicable. Features that did not remain significant after FDR correction were interpreted cautiously and treated as hypothesis generating, with emphasis placed on effect size, consistency of direction, convergence across feature categories and agreement with multivariate feature-importance analyses.
Univariate analyses were interpreted in conjunction with model-based feature importance. This approach allowed us to assess whether retinal vascular feature categories retained by Visionary AI corresponded to measurable differences in individual vascular features, while avoiding overinterpretation of any single univariate association.
Model performance evaluation
Model performance was evaluated using participant-level predictions. For cross-validated CU analyses, out-of-fold predictions from LOOCV were used to calculate performance metrics. For the NYU external validation cohort, predictions were generated by applying the CU-trained stability-optimized model to NYU participants without retraining, refitting, feature reselection or hyperparameter optimization using NYU outcome labels.
Primary model performance on the NYU cohort was summarized using the AUC and AP. AUC was used to evaluate discriminative performance across classification thresholds, whereas AP was used to summarize PR performance in the setting of class imbalance.
For analyses involving repeated CU population-wide control samplings, AUC and AP were calculated separately for each sampled evaluation set and summarized as the mean ± s.d. across samplings. The 95% confidence intervals were estimated from the s.e.m. across control settings. This evaluation strategy used multiple distinct population-wide control sets rather than upsampling preeclampsia cases, reducing the risk that performance estimates would be driven by repeated case duplication in the setting of low preeclampsia prevalence. By performing LOOCV across distinct population-wide control sets, these intervals summarize the variability of model performance across control definitions and provide an internal measure of robustness.
Threshold-based operating characteristics were also calculated, including TPR (sensitivity), FPR (1 − specificity), PPV, NPV and confusion-matrix counts. Threshold-based metrics were evaluated at prespecified classification thresholds and, where indicated, at thresholds corresponding to specified FPR operating points. Because PPV and NPV depend on outcome prevalence, predictive values from sampled CU evaluation sets were interpreted as sampled evaluation metrics and not as population-level screening estimates. Prevalence-adjusted PPV and NPV were calculated as described for clinical benchmarking.
Analyses involving subtypes, differential-diagnosis comparisons and demographic or clinical subgroups were interpreted descriptively when sample sizes were limited.
Reporting summary
Further information on research design is available in the Nature Portfolio Reporting Summary linked to this article.
Data availability
Because of participant privacy protections, the sensitive nature of retinal imaging and linked clinical pregnancy data and the terms of study consent and institutional review board approvals, individual-level data cannot be deposited in a public repository. Summary-level data supporting the key findings are included in the main text and Supplementary Information. Deidentified participant-level analysis datasets supporting the findings of this study, including derived retinal vascular features, outcome labels, relevant clinical covariates and accompanying metadata/data dictionaries, will be made available to qualified investigators upon reasonable request. Access will be contingent on approval by the relevant institutional review boards, confirmation that the proposed use is consistent with participant consent and applicable regulatory requirements and execution of an appropriate data use agreement. Data will be provided for noncommercial research purposes related to replication, validation or extension of the reported findings. Requests should be sent to Liat.Shenhav@nyulangone.org.
Code availability
Our data analysis code was deposited to GitHub (https://github.com/Shenhav-Lab/Visionary-AI-HDP/).
References
-
Say, L. et al. Global causes of maternal death: a WHO systematic analysis. Lancet Glob. Health 2, e323–e333 (2014).
-
Lo, J. O., Mission, J. F. & Caughey, A. B. Hypertensive disease of pregnancy and maternal mortality. Curr. Opin. Obstet. Gynecol. 25, 124–132 (2013).
-
Chappell, L. C., Cluver, C. A., Kingdom, J. & Tong, S. Pre-eclampsia. Lancet 398, 341–354 (2021).
-
Bushnell, C. & Chireau, M. Preeclampsia and stroke: risks during and after pregnancy. Stroke Res. Treat. 2011, 858134 (2011).
-
Davis, M. B. et al. Team-based care of women with cardiovascular disease from pre-conception through pregnancy and postpartum: JACC focus seminar 1/5. J. Am. Coll. Cardiol. 77, 1763–1777 (2021).
-
Samara, A. A. et al. Preeclampsia, gestational hypertension and incident dementia: a systematic review and meta-analysis of published evidence. Pregnancy Hypertens. 30, 192–197 (2022).
-
Koulouraki, S. et al. Short- and long-term outcomes of preeclampsia in offspring: review of the literature. Children (Basel) 10, 826 (2023).
-
American College of Obstetricians and Gynecologists Hypertension in pregnancy: report of the American College of Obstetricians and Gynecologists’ task force on hypertension in pregnancy. Obstet. Gynecol. 122, 1122–1131 (2013).
-
Than, N. G. et al. Integrated systems biology approach identifies novel maternal and placental pathways of preeclampsia. Front. Immunol. 9, 1661 (2018).
-
Than, N. G. et al. Classification of preeclampsia according to molecular clusters with the goal of achieving personalized prevention. J. Reprod. Immunol. 161, 104172 (2024).
-
Walsh, S. W. & Strauss, J. F. The road to low-dose aspirin therapy for the prevention of preeclampsia began with the placenta. Int. J. Mol. Sci. 22, 6985 (2021).
-
Brosens, I., Pijnenborg, R., Vercruysse, L. & Romero, R. The ‘great obstetrical syndromes’ are associated with disorders of deep placentation. Am. J. Obstet. Gynecol. 204, 193–201 (2011).
-
Kulkarni, V. G. et al. Maternal and fetal vascular lesions of malperfusion in the placentas associated with fetal and neonatal death: results of a prospective observational study. Am. J. Obstet. Gynecol. 225, 660.e1–660.e12 (2021).
-
Ahmed, I. et al. Placental inflammation and pregnancy outcomes: a prospective, observational study in South Asia: the PURPOSe study. Brit. J. Obstet. Gynaec. 130, 43–52 (2023).
-
Miller, D. et al. Cellular immune responses in the pathophysiology of preeclampsia. J. Leukocyte Biol. 111, 237–260 (2022).
-
Jung, E. et al. The etiology of preeclampsia. Am. J. Obstet. Gynecol. 226, S844–S866 (2022).
-
Stevens, W. et al. Short-term costs of preeclampsia to the United States health care system. Am. J. Obstet. Gynecol. 217, 237–248.e16 (2017).
-
Cameron, N. A. et al. Trends in the incidence of new-onset hypertensive disorders of pregnancy among rural and urban areas in the United States, 2007 to 2019. J. Am. Heart Assoc. 11, e023791 (2022).
-
Bruno, A. M., Allshouse, A. A., Metz, T. D. & Theilen, L. H. Trends in hypertensive disorders of pregnancy in the United States From 1989 to 2020. Obstet. Gynecol. 140, 83–86 (2022).
-
Phibbs, C. S. et al. Birth hospitalization costs and days of care for mothers and neonates in California, 2009–2011. J. Pediatr. 204, 118–125.e14 (2019).
-
Hao, J. et al. Maternal and infant health care costs related to preeclampsia. Obstet. Gynecol. 134, 1227–1233 (2019).
-
Rolnik, D. L., Wright, D. & Poon, L. C. Aspirin versus placebo in pregnancies at high risk for preterm preeclampsia. N. Engl. J. Med. 377, 613–622 (2017).
-
Hoffman, M. K. The great obstetrical syndromes and the placenta. Brit. J. Obstet. Gynaec. 130, 8–15 (2023).
-
US Preventive Services Task Force Screening for hypertensive disorders of pregnancy: US Preventive Services Task Force final recommendation statement. JAMA 330, 1074–1082 (2023).
-
Feng, W. & Luo, Y. Preeclampsia and its prediction: traditional versus contemporary predictive methods. J. Matern. Fetal. Neonatal Med. 37, 2388171 (2024).
-
Zeisler, H. et al. Predictive value of the sFlt-1:PlGF ratio in women with suspected preeclampsia. N. Engl. J. Med. 374, 13–22 (2016).
-
Ontario Health (Quality) First-trimester screening program for the risk of pre-eclampsia using a multiple-marker algorithm: a health technology assessment. Ont. Health Technol. Assess. Ser. 22, 1–118 (2022).
-
O’Gorman, N. et al. Multicenter screening for pre-eclampsia by maternal factors and biomarkers at 11–13 weeks’ gestation: comparison with NICE guidelines and ACOG recommendations. Ultrasound Obstet. Gynecol. 49, 756–760 (2017).
-
De Kat, A. C., Hirst, J., Woodward, M., Kennedy, S. & Peters, S. A. Prediction models for preeclampsia: a systematic review. Pregnancy Hypertens. 16, 48–66 (2019).
-
Silverman, R. H., Urs, R., Wapner, R. J. & Bearelly, S. Plane-wave ultrasound Doppler of the eye in preeclampsia. Transl. Vis. Sci. Technol. 9, 14 (2020).
-
Silverman, R. H. et al. Correlation of ocular plane-wave Doppler with optical coherence tomography angiography in preeclampsia. J. Ultrasound Med. 42, 2815–2824 (2023).
-
Jaffe, G. & Schatz, H. Ocular manifestations of preeclampsia. Am. J. Ophthalmol. 103, 309–315 (1987).
-
Stern-Ascher, C. N. et al. Subfoveal choroidal thickness and associated changes of angiogenic factors in women with severe preeclampsia. Am. J. Perinatol. 38, 482–489 (2021).
-
Garg, A. et al. Choroidal and retinal thickening in severe preeclampsia. Invest. Ophthalmol. Vis. Sci. 55, 5723–5729 (2014).
-
Auger, N. et al. Preeclampsia and long-term risk of maternal retinal disorders. Obstet. Gynecol. 129, 42–49 (2017).
-
Lee, J., Bae, J. G. & Kim, Y. C. Relationship between the sFlt-1/PlGF ratio and the optical coherence tomographic features of chorioretina in patients with preeclampsia. PLoS ONE 16, e0261287 (2021).
-
Srilaxmi, B. Eye towards artificial intelligence: retinal vascular tortuosity vs. vasoconstriction to differentiate preeclamptic and normotensive subjects. Am. J. Obstet. Gynecol. 230, 216–216 (2024).
-
He, Y. et al. Changes in optical coherence tomography angiography precede clinical onset of placental insufficiency. Invest. Ophthalmol. Vis. Sci. 66, 36 (2025).
-
Lupton, S. J. et al. Changes in retinal microvascular caliber precede the clinical onset of preeclampsia. Hypertension 62, 899–904 (2013).
-
Ciloglu, E., Okcu, N. T. & Dogan, N. Ç Optical coherence tomography angiography findings in preeclampsia. Eye (Lond.) 33, 1946–1951 (2019).
-
Wu, Y. et al. Noninvasive early prediction of preeclampsia in pregnancy using retinal vascular features. npj Digit. Med. 8, 188 (2025).
-
Zhou, T. et al. Prediction of preeclampsia from retinal fundus images via deep learning in singleton pregnancies: a prospective cohort study. J. Hypertens. 42, 701–710 (2024).
-
Zhou, Y. et al. A foundation model for generalizable disease detection from retinal images. Nature 622, 156–163 (2023).
-
Krielessi, V. et al. Placental pathology and blood pressure’s level in women with hypertensive disorders in pregnancy. Obstet. Gynecol. Int. 2012, 684083 (2012).
-
Antonios, T. F. T., Nama, V., Wang, D. & Manyonda, I. T. Microvascular remodelling in preeclampsia: quantifying capillary rarefaction accurately and independently predicts preeclampsia. Am. J. Hypertens. 26, 1162–1169 (2013).
-
Zhang, P. Decidual vasculopathy in preeclampsia and spiral artery remodeling revisited: shallow invasion versus failure of involution. AJP Rep. 8, e241–e246 (2018).
-
Yee Khong, T., Mooney, E. E., Nikkels, P. G. J., Morgan, T. K. & Gordijn, S. J. Pathology of the Placenta: A Practical Guide (Springer, 2018).
-
Tomita, R. et al. Differences in blood flow between superior and inferior retinal hemispheres. Invest. Ophthalmol. Vis. Sci. 61, 27 (2020).
-
Kamran, S. A. et al. RV-GAN: segmenting retinal vascular structure in fundus photographs using a novel multi-scale generative adversarial network. In Proc. 24th International Conference on Medical Image Computing and Computer Assisted Intervention (eds de Bruijne, M. et al.) (Springer, 2021).
-
Staal, J., Abràmoff, M. D., Niemeijer, M., Viergever, M. A. & van Ginneken, B. Ridge-based vessel segmentation in color images of the retina. IEEE Trans. Med. Imaging 23, 501–509 (2004).
-
Hoover, A., Kouznetsova, V. & Goldbaum, M. Locating blood vessels in retinal images by piecewise threshold probing of a matched filter response. IEEE Trans. Med. Imaging 19, 203–210 (2000).
-
Fraz, M. M. et al. An ensemble classification-based approach applied to retinal blood vessel segmentation. IEEE Trans. Biomed. Eng. 59, 2538–2548 (2012).
-
Budai, A., Bock, R., Maier, A., Hornegger, J. & Michelson, G. Robust vessel segmentation in fundus images. Int. J. Biomed. Imaging 2013, 154860 (2013).
-
Zhang, J. et al. Robust retinal vessel segmentation via locally adaptive derivative frames in orientation scores. IEEE Trans. Med. Imaging 35, 2631–2644 (2016).
Acknowledgements
We are deeply grateful to the individuals who participated in the clinical cohorts at CU and NYU, as well as to their families, whose time and contributions made this research possible. We also thank the study teams, including research coordinators, imaging technicians, clinicians, data personnel, volunteers, managers and administrative staff. We thank S. Bousleiman, N. Pensec, D. Wentsler, Y. Gutierrez, Z. Castillo, J. Castillo Camacho, C. Almonte, C. Masson, A. Kaminsky, A. P. Moscoso, R. Pena Recio, E. Carmona Reyes, D. Torres, S. Maruri, K. Thakoor, Y. Tian, H. Ressa and M. Hayes for their invaluable contributions to this work.
Funding
L.S., C.A., D.S. and S.P. are supported by Burroughs Wellcome Fund (CASI award G-1022553). S.B. was supported by the CU Irving Institute for Clinical and Translational Research (CTSA Grant UL1TR001873), the Dalio Center for Health Justice at NewYork-Presbyterian and the New York Community Trust—Frederick J. and Theresa Dow Wallace Fund (administered through CU and NewYork-Presbyterian).
Ethics declarations
Competing interests
The authors declare no competing interests.
Peer review
Peer review information
Nature Biotechnology thanks Qionghai Dai and the other, anonymous, reviewer(s) for their contribution to the peer review of this work.
Additional information
Publisher’s note Springer Nature remains neutral with regard to jurisdictional claims in published maps and institutional affiliations.
Extended data
Extended Data Fig. 1 High-contrast Visionary AI model predicts preeclampsia in the CU cohort.
a, ROC and PR curves for the high-contrast Visionary AI model, the FMF risk calculator and the combined Visionary AI + FMF model, distinguishing preeclampsia cases (n = 54) from healthy controls (n = 82). Panel legends report the area under the ROC curve (AUC) and average precision (AP). b, Threshold-based operating characteristics of the high-contrast Visionary AI model for preeclampsia overall and by subtype. Bar plots show AUC, positive predictive value (PPV), negative predictive value (NPV) and true-positive rate (TPR) at a classification threshold of 0.5. The corresponding false-positive rate (FPR) was 0.11 across all subtype evaluations. c, Ranked metalearner importance of retained base learners in the high-contrast model. Colors indicate the corresponding retinal vascular feature categories. PEC, preeclampsia; SF, severe features; NSF, no severe features; EOPE, early-onset preeclampsia; LOPE, late-onset preeclampsia; NPV, negative predictive value; TPR, true positive rate; HC, healthy controls; PPV, positive predictive value; AP, average precision; AUC, area under the receiver operating characteristic curve; LR, logistic regression; RF, random forest; XGB, eXtreme Gradient Boosting; TDA, topological data analysis; FMF, Fetal Medicine Foundation.
Extended Data Fig. 2 Progressive base-learner selection for the stability-optimized Visionary AI model.
a, Overview of the successive filtering and selection steps used to derive the final stability-optimized model. The initial base-learner search space was reduced through stable hyperparameter selection and AUC/AP thresholding, hyperparameter tuning and recursive feature elimination within leave-one-out cross-validation, and importance-based selection with removal of learners based on redundant feature sets. b, Number of base learners retained for each of the five population-wide control groups after each selection step. Each group began with 96 candidate base learners and retained eight in the final model. BL, base learner; HP, hyperparameter; AUC, area under the receiver operating characteristic curve; AP, average precision; RFE, recursive feature elimination; PW, population-wide; CU, Columbia University; LOOCV, leave-one-out cross-validation.
Extended Data Fig. 3 Stability-optimized Visionary AI distinguishes preeclampsia from other hypertensive disorders in the NYU validation cohort.
ROC and PR curves for the stability-optimized Visionary AI model, the FMF risk calculator and the combined Visionary AI + FMF model, distinguishing participants with preeclampsia (n = 13) from those with gestational hypertension (n = 7) or chronic hypertension, no superimposed preeclampsia (n = 2). Panel legends report the area under the ROC curve (AUC) and average precision (AP). AUC, area under the receiver operating characteristic curve; AP, average precision; GHTN, gestational hypertension; CHTN, chronic hypertension.
Extended Data Fig. 4 Metalearner base-learner importance of retained base learners in the stability-optimized CHTN model.
Heatmap showing the metalearner importance of retained base learners across the five population-wide control groups. Colors indicate the corresponding retinal vascular feature categories. PW, population-wide controls; CHTN, chronic hypertension; LR, logistic regression; RF, random forest; XGB, eXtreme Gradient Boosting; TDA, topological data analysis.
Extended Data Fig. 5 Retinal vascular features associated with gestational and chronic hypertension.
Boxplots compare selected retinal vascular features among healthy controls healthy-control (n = 82), population-wide (n = 1134) controls, participants with gestational hypertension (GHTN; n = 49) and participants with chronic hypertension (CHTN; n = 71; including 10 patients with CHTN with superimposed PEC). Features were selected based on their importance in the stability-optimized models and illustrate both shared and disorder-specific associations. Boxes show the interquartile range, center lines indicate the median, whiskers extend to the most extreme values within 1.5 × the interquartile range and points represent individual participants. Sum weighted nesting ratio differed for both GHTN and CHTN relative to healthy controls (GHTN, P = 9.29 × 10⁻5; CHTN, P = 5 × 10⁻4) and population-wide controls (GHTN, P = 0.002; CHTN, P = 0.005). Branch count differed for both GHTN and CHTN relative to healthy controls (GHTN, P = 0.02; CHTN, P = 7 × 10⁻4) and for CHTN relative to population-wide controls (P = 0.004). By contrast, flooding TDA (PC2) differed only for GHTN relative to healthy controls (P = 0.003) and population-wide controls (P = 0.014), whereas outward TDA (PC3) differed only for CHTN relative to healthy controls (P = 0.006) and population-wide controls (P = 0.05). P values were calculated using two-sided Mann–Whitney U tests. PW, population-wide controls; GHTN, gestational hypertension; CHTN, chronic hypertension; HC, healthy controls; TDA, topological data analysis; PC, principal component.
Extended Data Fig. 6 Multi-image vessel-segmentation merging pipeline.
Overview of the workflow used to merge vessel segmentation images (VSIs) obtained from multiple images of the same eye. During image acquisition, additional images were obtained when eyelashes, eyelids, shadows or positioning artifacts obscured portions of the retinal vasculature. The first image, or the current merged image, was paired with the next available image and subjected to coarse alignment using ORB-based homography, followed by local refinement using deformable registration. The aligned segmentations were then merged, and the process was repeated sequentially until all available images had been incorporated. The resulting binary image provides a more complete vascular segmentation and reduces sensitivity to localized artifacts and incomplete vessel detection. ORB, oriented FAST and rotated BRIEF; VSI, vessel segmentation image.
Supplementary information
Rights and permissions
Open Access This article is licensed under a Creative Commons Attribution-NonCommercial-NoDerivatives 4.0 International License, which permits any non-commercial use, sharing, distribution and reproduction in any medium or format, as long as you give appropriate credit to the original author(s) and the source, provide a link to the Creative Commons licence, and indicate if you modified the licensed material. You do not have permission under this licence to share adapted material derived from this article or parts of it. The images or other third party material in this article are included in the article’s Creative Commons licence, unless indicated otherwise in a credit line to the material. If material is not included in the article’s Creative Commons licence and your intended use is not permitted by statutory regulation or exceeds the permitted use, you will need to obtain permission directly from the copyright holder. To view a copy of this licence, visit http://creativecommons.org/licenses/by-nc-nd/4.0/.
About this article

Cite this article
Bearelly, S., Areff, C., Hoffman, M.K. et al. Decoding systemic vascular health and hypertensive disorders in pregnancy through retinal imaging and Visionary AI. Nat Biotechnol (2026). https://doi.org/10.1038/s41587-026-03303-0
-
Received:
-
Accepted:
-
Published:
-
Version of record:
-
DOI: https://doi.org/10.1038/s41587-026-03303-0