Researchers at Baylor College of Medicine, the Duncan Neurological Research Institute (Duncan NRI) at Texas Children’s Hospital, and collaborating institutions have identified new genetic candidates that help explain why autism is diagnosed about four times more often in boys than it is in girls. The study, involving tests in induced pluripotent stem cell (iPSC)-derived neurons (iNeurons), revealed that small changes in the gene MECP2 on the X chromosome might help explain part of this difference.
Huda Zoghbi, MD, Distinguished Service Professor at Baylor, director of Duncan NRI, and a Howard Hughes Medical Institute investigator, is senior and corresponding author of the team’s published paper in The American Journal of Human Genetics, titled “A massively parallel reporter assay of MECP2 cis-regulatory elements reveals genetic candidates for male-biased autism.” In their paper, the team concluded, “These findings suggest noncoding MECP2 variants can cause idiopathic, male-biased autism and provide a framework for uncovering regulatory variants in other X chromosome neurodevelopmental genes that may contribute to autism’s missing heritability.”
“Autism is a common, heritable neurodevelopmental trait that affects how a person communicates, interacts with others, and experiences the world, and is characterized by altered social interactions and restricted, repetitive behaviors or interests,” Zoghbi explained. “It is diagnosed about four times more in male individuals than in female individuals, suggesting sex-specific factors may increase male vulnerability,” the researchers added in their paper.
In the current study, the researchers drew from their long experience with gene MECP2, which is on the X chromosome and has been associated with neurodevelopmental conditions, including autism. “We tested the idea that the predominance of autism in males could be explained in part by mild mutations in an X chromosome gene’s regulatory regions,” commented Rebecca Meyer-Schuman, PhD, a postdoctoral associate in the Zoghbi lab. “Females might be protected from such a mild mutation because of their second X chromosome, but males, who have only one copy, would be more vulnerable. The regulatory regions are like dials that control whether a gene will be expressed and by how much. And what better place to start looking at these regulatory regions than the gene MECP2, where brain health depends on how much of the gene is expressed, and where mutations can cause neurodevelopmental disorders that include autism.”
Previous murine studies by Zoghbi lab and others have taught researchers that MECP2 produces a Goldilocks protein, meaning that it must maintain a “just right” concentration or activity level for a healthy brain. Having too little—about 50% or less of the normal levels—leads to Rett syndrome, and having twice the normal levels causes a different neurodevelopmental condition called MECP2 duplication syndrome. “Both loss-of-function and gain-of-function variants lead to severe neurodevelopmental conditions—Rett syndrome (MIM: 312750) and MECP2 duplication syndrome (MDS; MIM: 300260[intellectual developmental disorder, X-linked, syndromic, Lubs type (MRXSL)]), respectively,” the authors commented. “Because MECP2 is on the X chromosome, hemizygous male individuals have a more severe phenotype than heterozygous female carriers with the same variant.”
Meyer-Schuman also noted, “Previous studies in mice also showed us that milder changes in MECP2 levels, for instance reducing the expression by 30% or increasing it by 50%, do not cause the more severe features of Rett syndrome or MECP2 duplication syndrome like seizures or motor problems, but lead to autism-like behaviors.”
For their current study the team used a massively parallel reporter assay (MPRA) to screen the regulatory regions of the MECP2 gene in induced pluripotent stem-cell (iPC)-derived neurons. “This allowed us to identify and manipulate the regulatory regions and determine what kinds of changes would alter their function,” Meyer-Schuman said. The researchers also screened MECP2 regulatory regions in autistic individuals and tested the genetic variants they identified using the MPRA assays.
“We identified two regulatory regions where male autistic individuals inherited a variant from their unaffected mother that altered regulatory activity,” Meyer-Schuman said. “One of these variants reduced MECP2 expression by approximately 30% in human neurons, a magnitude that produces social deficits, hyperactivity and anxiety-like characteristics in mice. As predicted by the mouse model, this individual was diagnosed with autism and ADHD but had none of the defining characteristics of Rett syndrome.”
In their paper, the authors commented that their work supports a broader hypothesis that altered dosage or expression of sex chromosome genes are a major source of the male bias observed in autism. Zoghbi added, “These findings, a result of integrating human and animal studies, suggest that MECP2 regulatory variants can contribute to male-biased autism and reveal just the tip of the iceberg, providing a framework for uncovering regulatory variants in other X chromosome neurodevelopmental genes that may contribute to autism’s missing heritability.”
Studies of the immune system show that two people born on the same day can have immune systems that age differently, leaving some older adults with resilient defense systems and others with dysfunctional ones that put them at increased risk for age-related diseases. Now a new study led by scientists at Washington University School of Medicine in St Louis, Nationwide Children’s Hospital in Ohio, and King’s College London provides a map of human immune aging that could help explain these different trajectories. Details are published in a new Immunity paper titled “Single-cell analyses of global cohorts outline determinants of immune aging and link the ratio of GZMK⁺ to GZMB⁺ Tem cells to health trajectories.”
According to the paper, a ratio between two immune cell types can reveal whether someone stays healthy or may face risk of future disease. To get to this insight, the scientists first analyzed approximately 12.4 million individual immune cells from the blood of over 2,600 mainly healthy adults ages 20 to 90-plus across eight cohorts in North America, the United Kingdom, Asia, and Australia.
Their analysis showed that while the blood of younger people was uniformly enriched with naive immune cells that had not been exposed to specific pathogens and remained adaptable to new infections or vaccines, older immune systems were more diverse. Specifically, some older participants had a greater abundance of immune cells that reflect inflammation.
To map this shift, the researchers placed each participant on a spectrum based on the ratio between two types of white blood cells: specifically, granzyme B-producing cells and granzyme K-producing cells. Some white blood cells, known as effector memory CD8 T cells, use granzymes to destroy target cells or coordinate immune responses. While granzyme B-producing cells serve as direct destroyers of diseased cells, granzyme K-producing cells have been less studied and may play a role in boosting immune responses.
Next, the researchers evaluated whether participants’ positions on the spectrum, which corresponds to a specific type of CD8 T cell, could dictate their risk of getting sick. In other words, they looked at whether having more of one type of CD8 T cell has an impact on the person’s health as they age. To answer that question, the scientists turned to the UK Biobank.
While that dataset includes protein information from the participants, it lacks counts of CD8 T cells. To get around this hurdle, the scientists used a smaller dataset of seemingly healthy adults that included data on CD8 T cell counts and blood proteins to create a computer model to map out the protein tracks left behind when either granzyme B-producing or granzyme K-producing cells dominated. They then applied this model to the baseline blood protein samples of 50,000 participants from the UK Biobank, calculating their position on the immune cell spectrum.
Using this approach, the scientists were able to draw out some useful insights for their work. Specifically, they found that healthy adults whose immune system leaned heavily toward granzyme B cells at baseline tipped the scale toward a higher risk of death a decade later compared to those with more granzyme K cells. The granzyme B-dominant group also was more likely to develop chronic conditions, including Type 2 diabetes, hypertension, liver disease, and renal failure, among others, over the following decade.
“A higher level of granzyme B cells in a healthy state means the immune system might be already reacting to something,” said Marina Terekhova, MD, a professor in pathology & immunology at WashU Medicine and one of the co-authors on the paper. “It isn’t a formal disease diagnosis, but it may indicate the body is off track.”
A healthy immune system gradually shifts toward granzyme K cells over time, while an immune system that leans toward granzyme B cells signals unhealthy aging. Because individuals can reach this granzyme B state much earlier in life, their immune systems age on different trajectories, explaining why two people born in the exact same year can face different risks for chronic disease and death decades later.
These findings point to “clues in the blood that can tell us whether someone is on a healthy or unhealthy aging trajectory,” said Maxim Artyomov, PhD, the alumni endowed professor of pathology and immunology at WashU Medicine and one of the corresponding authors on the paper. Artyomov and his lab are now adapting their research into a simple blood test that can be processed using standard equipment. “Identifying specific biological red flags in the immune system could pave the way for early-warning tests that spot disease risks years before a clinical diagnosis.”
Multiomics analysis combines data from two or more omics layers—such as genomics, transcriptomics, proteomics, and epigenomics. However, published criticisms of multiomics approaches have highlighted concerns about data integration and a tendency toward false-positive findings.1–3
What additional roadblocks might accompany ambitious multiomics projects in 2026? Could any bottlenecks emerge in cost, sample preparation, data integration, or AI implementation? We recently interviewed experts from five companies to gain their perspectives. Here is what they had to say.
Sample preparation
“I sound like a broken record because I can’t stop talking about the importance of sample prep in multiomics work,” says Michael Easterling, PhD, vice president of MALDI/Imaging at Bruker Daltonics.
Easterling stresses challenges such as section-to-section variability, internal standards, FFPE samples, and long sample runs that complicate downstream algorithms. “For multiomics imaging, these issues are not as well defined as some of the bulk methods that have been around much longer,” he notes.
Scott Jelinsky, PhD, senior director of R&D at Thermo Fisher Scientific, agrees. “Different molecular classes have different requirements for sample collection, storage, and preparation,” he says. “Therefore, careful experimental design and standardization are essential.”
Easterling mentions the consequences of inadequate freezing during biopsies, which can disrupt cell structures and lead to ice crystal artifacts. “It is important to really make sure that you have a solid workflow to correctly harvest tissue and provide a good chain of custody from the point that it’s harvested all the way to the analyzer.”
What are some tips for multiomics researchers hoping to prepare their samples in an optimal way? “Community networking is key here,” argues Easterling. “I would say get involved with the overall spatial imaging community and network and find out exactly how to do these things.”
Another practical consideration, according to Jelinsky, is planning the workflow from the beginning so that sample collection, aliquoting, storage, and analytical requirements are compatible across different assays. “Decisions made early in the study can have a significant impact on what can be measured and how confidently the different datasets can be interpreted together,” he notes.
Data integration and analysis
Multiomics technologies generate vast amounts of high-resolution data across modalities that often behave differently from a statistical perspective, notes Najiba Mammadova, PhD, associate director of product management at 10x Genomics. “Multiomics assays have advanced incredibly quickly, and now the analysis and interpretation tools need to keep pace,” she notes.
Mammadova specifically highlights the challenges of computationally aligning multiple omics from different cells or tissues. After all, how can researchers be certain that they are measuring the same cells and biological features?
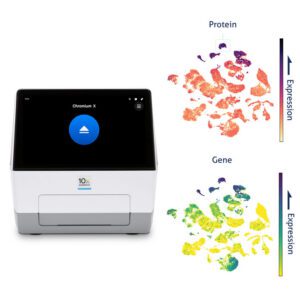
The 10x Genomics MultiPro Human Discovery Panel, which integrates into existing Flex scRNA-seq workflows, is the largest antibody-based, single-cell protein panel, enabling integrated analysis of 326 protein targets. [10x Genomics]
“That’s why I think measuring multiple modalities from the same cell or tissue is so important,” she adds. “It reduces the need to reconstruct the biology after the fact and gives researchers a more direct view of what’s happening in the sample.”
Vanee Pho-Conners, PhD, vice president of global marketing at Mission Bio, agrees that data integration is often a major hurdle with multiomics work. “Each omics layer has its own data structure, distributions, and variabilities, so combining them isn’t plug-and-play,” she explains. Multiomics analysis also often requires cross-disciplinary expertise in biostatistics, machine learning, and biology—capabilities many labs lack in-house.
“It’s important to ask how you can combine these data sets in a clean way where you preserve all the information, reduce the noise, and start to make biological inferences,” adds Easterling. “It’s not something that’s routine today, but the situation is changing rapidly, and new ways to integrate these datasets of varying dimensionality are starting to appear.”
Timing is yet another important consideration, notes Jelinsky. Proteins, RNA, and metabolites may exhibit different kinetics and respond on different timescales, so measurements collected at the same time may not always align. “Understanding those temporal relationships is essential when integrating and interpreting the results,” he says.
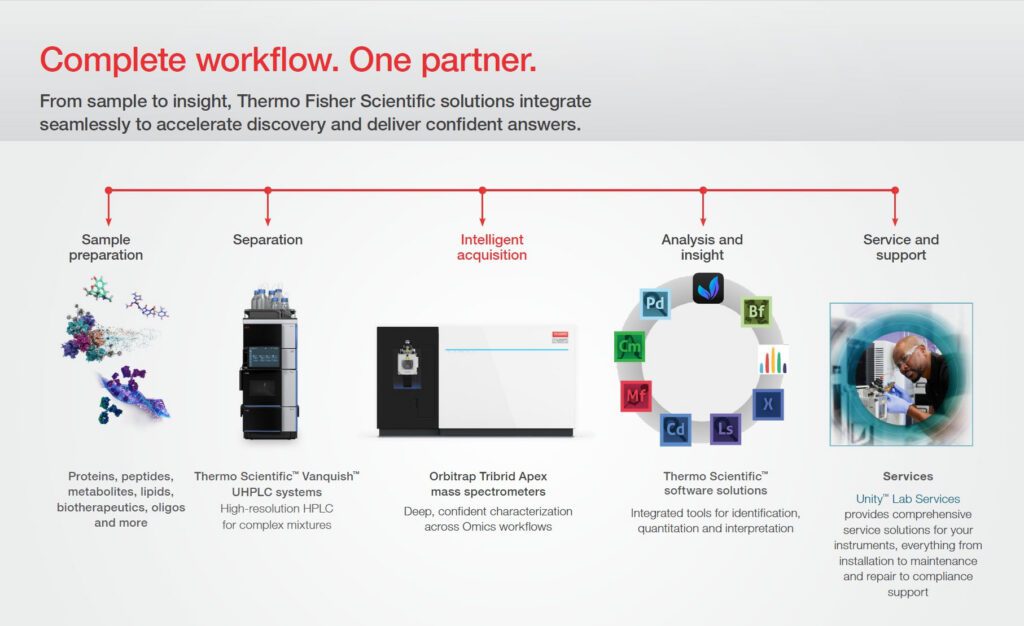
Thermo Fisher’s multiomics solutions include services as well as products for sample preparation, separation, acquisition, and analysis. [Thermo Fisher]
AI and multiomics
“I think the rate-limiting multiomics questions are shifting from ‘Can we measure this?’ to ‘Can we interpret it?’ And that’s where AI has enormous potential,” notes Mammadova. “We’re generating increasingly rich, high-dimensional datasets, and AI can help researchers identify patterns, interpret those data more quickly, and ultimately build models that can predict things like disease progression or treatment response.”
However, Easterling warns that even the most advanced AI technologies often cannot overcome challenges associated with inadequate sample preparation. “Unfortunately, if a model’s trained on an inconsistently prepared section, it’ll give you a confident biological story that’s completely wrong. And the reader of this data may have no way to tell.”
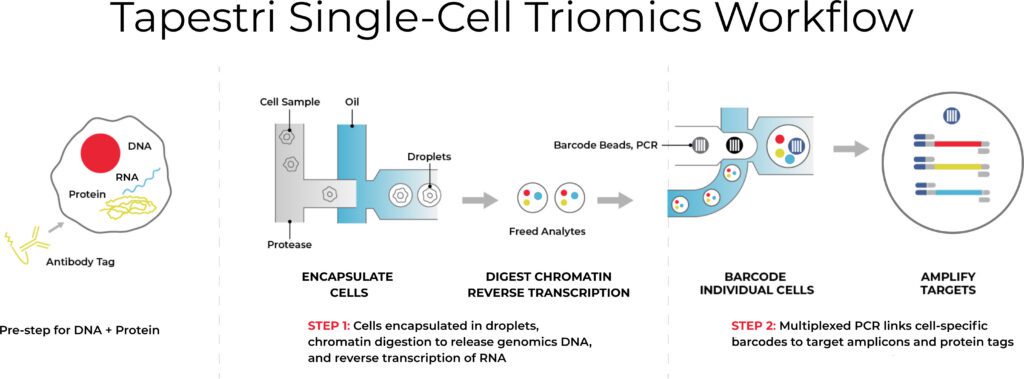
The DNA, RNA, and protein workflow on Tapestri’s single-cell platform. Each cell is encapsulated in its own droplet, and a unique molecular barcode (specific to each cell) gets attached to each DNA, RNA, and protein molecule. [Mission Bio]
As an example of recent AI advances, Easterling highlights multiomic workflows pioneered at the Medical University of South Carolina for single-cell analysis. The group has developed an AI algorithm that assists lasers in targeting individual cells rather than clusters of cells.4 Pho-Conners also emphasizes how Mission Bio is using machine learning to jointly cluster DNA, RNA, and protein—referred to as triomics—from the same cell. “We are using a combination of triomics and AI-driven integration to establish disease resistance. This really goes beyond correlations using a single omics layer,” she says.
Although Jelinsky is generally optimistic about AI advances in multiomics, he foresees fundamental limitations. “I see AI as a tool that can help researchers navigate complexity and generate better hypotheses rather than as a replacement for scientific judgment. AI does not remove the need for rigorous experimental design or biological validation,” he stresses.
Challenges with extracellular vesicles
Distinct multiomics challenges also exist in analyzing extracellular vesicles (EVs), small membrane spheres released by cells that contain multiple omics (DNA, RNA, protein, metabolites, and lipids).
“EVs are how cells talk to each other, and a living cell sends up to ten thousand a day. This makes them good biomarkers,” says Pierre Arsène, founder and CEO of Mursla Bio.
However, with traditional EV analysis, each potential omics layer is measured from EVs derived from an unknown blend of cells. There is usually no way to know whether a protein signal and an RNA signal came from the same tissue, for instance.
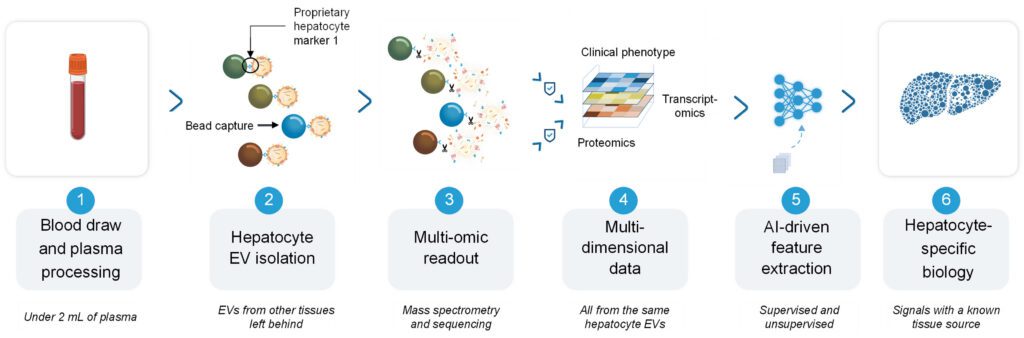
Mursla’s biomarker discovery workflow for tissue-specific extracellular vesicles. Antibody-coated magnetic beads capture hepatocyte-derived vesicles from under two milliliters of plasma, leaving behind extracellular vesicles from other tissues. [Mursla Bio]
“Tissue-specific extracellular vesicles (TS-EVs) are how we recover that record,” explains Arsène. Mursla’s technology begins with a blood draw. Liver-specific EVs are then captured using antibodies against proprietary surface markers (more specifically, hepatocyte-EV markers). Finally, proteomics and RNA sequencing are performed on two milliliters of plasma for biomarker discovery.
“The great thing about TS-EVs is that they arrive addressed, carrying surface proteins specific to the sending cell and sealed behind a membrane that shields proteins and RNA from the enzymes that would destroy them in blood.”
EvoLiver, Mursla’s blood test for liver cancer surveillance in cirrhotic patients, holds an FDA Breakthrough Device Designation. It analyzes three proteins and five microRNAs derived from hepatocytes. Proteins provide information about tumor surface phenotype and metabolic reprogramming, while microRNAs reveal the regulatory programs driving that phenotype.
As with so many other multiomics platforms, Arsène stresses the importance of TS-EV sample preparation. “Blood handling standards for EVs lag well behind standard liquid biopsy, so our clinical work relied mostly on prospective collection under a common protocol rather than using legacy biobanks.”
The future of multiomics
Mammadova highlights the potential for cost-related challenges in multiomics, particularly as the field moves toward larger studies. “Making these technologies more scalable and cost-effective will be critical to expanding their use across research,” she adds.
“However, I see more overall challenges than roadblocks in multiomics work,” she concludes. “They’re the kind of problems the field works through as technologies mature.”
Detection of the whole transcriptome along with over 64 proteins in a human breast cancer FFPE tissue section using Bruker’s CosMx spatial molecular imager. [Bruker Spatial Biology]
Spatial multiomic layers will also become increasingly critical for decoding the complexity of disease biology, predicts Prajan Divakar, PhD, Bruker Spatial Biology vice president of product management. “Investigators continue to demonstrate the need for more complete spatial datasets, and we are seeing clear applications and momentum for clinical translation,” he says. Divakar highlights Bruker’s CosMx® spatial molecular imager, which measures the whole transcriptome and over 64 proteins.
Finally, Arsène argues that simply adding more layers of analysis without biological resolution is unlikely to advance multiomics research in the future. For instance, in the largest study of a blood-based cancer test ever run (involving around 50,000 participants), incorporating an additional protein layer in advanced adenoma increased the sensitivity only modestly—from about 15% to 16%.5 “More and more layers allow you to gain dimensions, but you end up losing coherence. And no cohort in the world is large enough to train that coherence back computationally.”
Jelinsky agrees that the value of multiomics will lie not in generating more data, but in selecting complementary measurements that address a specific biological question. “I think the future of multiomics will be less about generating the largest possible number of measurements and more about determining which combination of measurements provides the most meaningful biological insight,” he says.
References
Behrens LMP, Fernandes GDS, Gonçalves GF, et al. Limitations and opportunities in multi-omics integration for neurodevelopmental, neurodegenerative and psychiatric disorders: A systematic review. Neuroscience. 2026;599:76-93. doi: 10.1016/j.neuroscience.2026.01.019.
Hayes CN, Nakahara H, Ono A, Tsuge M, Oka S. Genes (Basel). From Omics to Multi-Omics: A Review of Advantages and Tradeoffs. 2024;15(12):1551. doi: 10.3390/genes15121551.
Baião AR, Cai Z, Poulos RC, et al. A technical review of multi-omics data integration methods: from classical statistical to deep generative approaches. Brief Bioinform. 2025;26(4):bbaf355. doi: 10.1093/bib/bbaf355.
Dressman JW, Bayram MF, Angel PM, Drake RR, Mehta AS. Single-Cell Multiomic MALDI-MSI Analysis of Lipids and N-Glycans through Affinity Array Capture. Anal Chem. 2025;97(24):12493-12502. doi: 10.1021/acs.analchem.4c06233.
Shaukat A, Burke CA, Chan AT, et al. Clinical Validation of a Circulating Tumor DNA-Based Blood Test to Screen for Colorectal Cancer. JAMA. 2025;334(1):56-63. doi: 10.1001/jama.2025.7515.
If “Spatial Biology” conjures images of a science conducted in zero gravity aboard the International Space Station, think again. As one of the most rapidly advancing areas in biomedical research and precision medicine, spatial biology probes the inner landscape of intact cells and tissues down to single-molecule resolution. By preserving location and organization, instead of dissociating tissue into component parts, this discipline maps fine architecture, cellular neighborhoods, and individual molecules.
Maintaining that context is driving new ways of characterizing disease progression, identifying biomarkers, advancing therapeutics, and monitoring treatment responses. Fueling these advances is an expanding toolbox that encompasses high-plex imaging, spatial transcriptomics and proteomics, multiomic profiling, and increasingly sophisticated computational analyses. We consulted industry leaders about how the field is progressing, barriers that remain, and their vision for what is needed to propel spatial biology into its next phase.
Scaling spatial discovery
While genomics and single-cell sequencing profile molecular features and cellular states, spatial biology answers questions that neither can address, such as where those features and cells are located and how they are organized.
Kamila Belhocine, PhD Senior Director 10x Genomics
“When you dissociate a tissue into individual cells, you lose something fundamental: where those cells were and how they were organized relative to one another,” observes Kamila Belhocine, PhD, senior director of spatial biology at 10x Genomics. She continues: “Spatial biology puts that context back. In cancer, for example, knowing that a particular immune cell population is present within a tumor sample is useful. But knowing whether those cells have infiltrated the tumor core, are sitting at its margin, or are excluded from it altogether can tell you something very different about the biology, and potentially, about response to treatment. The same principle applies to understanding tissue architecture in cases like development and cell differentiation, and disease progression.”
Several barriers have prevented spatial biology from going mainstream in the biopharma/biotech industry. Belhocine says, “I think about four things: speed, reliability, cost, and interpretability. Spatial needs to be fast enough to fit into routine research workflows, robust enough to generate consistent results at scale, affordable enough to use across large studies and, ultimately, straightforward enough to turn the resulting data into biological insight. The first three are fundamentally technology and engineering challenges. Interpretability is harder because it also requires accumulating evidence and validating which spatial signatures are truly meaningful and actionable.”
However, according to Belhocine, single-cell technologies had to address similar issues. “A decade ago, single-cell analysis was largely a specialized technique. Continued innovation made it easier, more scalable, more robust, and dramatically more cost-effective, opening it to a much broader community and enabling much larger studies. We think spatial is following a similar trajectory.”
Gary Latham, PhD Chief Technology Officer Bio-Techne
Belhocine says the company’s newest spatial instrument, Atera, which will be shipping in the second half of the year, is an important step in that progression. “This technology combines whole-transcriptome spatial profiling with single-cell sensitivity and subcellular resolution at a massive scale designed for much larger studies.”
Looking ahead, Belhocine predicts, “As spatial technologies become more scalable, robust and cost-effective, researchers can apply them across much larger patient cohorts to identify biomarkers and signatures of treatment response. Additionally, AI will undoubtedly accelerate that trajectory even further.”
Spatial multiomics
Gary Latham, PhD, CTO, Bio-Techne, provides another perspective on the role of integrating protein analysis and gene expression in spatial biology. “A fuller understanding of tissue biology requires seeing where proteins and genes are expressed, how they relate, and how they interact within the tissue architecture.”
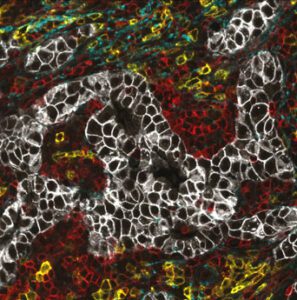
Automated spatial biology systems enable high-throughput, hyperplexed analysis of tissue samples. Human breast cancer sample stained with 105-plex multiomics panel on COMET. The image shows a HER2+ tumor with HER+ cells and immune infiltrates. Markers shown: HER2 (white), collagen I (teal), CD45 (red), and CD38 (yellow). [Bio-Techne]
This molecular multiplexing can provide a more complete view of tissue biology. “Spatial biology is unique from other technologies because it takes us from seeing what is there to understanding what is where,” says Latham. He continues, “This is critical because biology can’t be understood as a parts list. Instead, it is a dynamic system of interactions and networks where location defines meaning. While single-cell sequencing can tell you which cell types exist and their molecular states, spatial biology tells you how those cells are organized, how they may be interacting, and how these relationships may influence disease biology and clinical outcomes.”
Latham indicates that the field is working to overcome several challenges. “There is a need for reproducible, standardized automation for today’s biomarkers and tomorrow’s multiomic precision medicine. Many spatial biology workflows remain exploratory and manual during early discovery phases. As programs move toward translational research, the focus shifts to robustness, reproducibility, and standardized, validated workflows. Ultimately, clinical adoption requires validated panels, automation, and throughput suited to routine testing.”
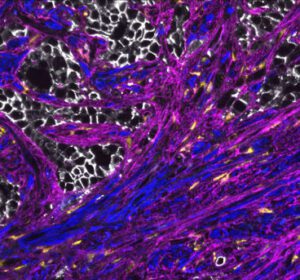
Automated spatial biology systems enable high-throughput, hyperplexed analysis of tissue samples. Human prostate cancer sample stained with a 105-plex multiomics panel on COMET. The image shows tissue fibrosis associated with cancer-associated fibroblasts (CAFs). Markers shown: COL1A1 RNA (yellow), E-Cadherin (white), alpha-SMA (blue), and FAP (magenta). [Bio-Techne]
According to Latham, Bio-Techne is helping address these barriers in several ways. Its COMET Suite provides an end-to-end automated platform for hyperplex immunofluorescence and multiomics staining, imaging, and analysis of tissue samples. Additionally, its RNAscope portfolio enables same-section multiomics, with 80,000 RNA probes spanning 450 species and compatibility with multiple automated staining instruments.
Latham believes the spatial multiomics approach can connect gene and protein expression with tissue architecture within the same cells and microenvironment, revealing biological relationships and linking state to function that no single modality can uncover.
He says several areas are seeing the fastest adoption of spatial biology. “Oncology and immuno-oncology continue to dominate spatial biology applications, while immunology and neuroscience represent the next-most prominent areas of focus. Biodistribution of gene therapies is an especially high-impact application: spatial multiomics can localize an AAV vector, transgene mRNA, or oligonucleotide therapeutics such as ASOs and siRNAs to specific cells, then measure changes in the target or downstream gene expression and the associated protein phenotype.”
Integrated discovery & translation
Spatial biology is increasingly moving beyond simply identifying where cells are located to understanding how cellular neighborhoods, cell–cell interactions, and biological pathways shape disease biology. As Thomas Campbell, PhD, senior director of product management for Bruker Spatial Biology, explains, “Biology is inherently multi-dimensional, and no single spatial technology can or will capture every aspect of that complexity. The field needs multiple fit-for-purpose approaches that allow researchers to ask different questions and connect insights across DNA, RNA, proteins, and cellular function.” This ability to examine biology from complementary perspectives is becoming increasingly important as spatial research moves from discovery toward translation.
According to Campbell, understanding these context-dependent differences is driving the field. “The next phase of spatial biology will be about using high-plex discovery to develop focused, quantitative assays that can be deployed across large cohorts. One of the biggest challenges in translational biopharma is the discovery-to-translation gap. A study may identify dozens or hundreds of potentially relevant biomarkers, but a translational or clinically deployable assay demands a much smaller, highly reproducible panel.”
Thus, defining a clinically relevant spatial signature requires insights across the genome, transcriptome, and proteome. Campbell says Bruker Spatial Biology’s portfolio comprises platforms spanning multiple omic layers—including DNA, RNA, proteins, post-translational modifications, miRNA and live cell function—“because we recognize that no single modality can fully resolve the biological complexity that drives disease.”
Thomas Campbell, PhD Senior Director Bruker Spatial
That integrated approach is reflected in several of the company’s platforms. CosMx® Spatial Molecular Imager (SMI) provides a view of the whole transcriptome at subcellular resolution, while enabling the simultaneous measurement of RNA and protein within the same tissue section. The CellScape™ XR platform provides quantitative spatial proteomics using flexible assay chemistry. Meanwhile, the GeoMx® Digital Spatial Profiler (DSP) profiles the whole transcriptome and more than 1,200 proteins from distinct tissue compartments. Campbell says that, together, these three platforms “provide complementary views of biology and, when used together, enable a more complete understanding of cellular function across multiple omic layers.”
Campbell sees this transition from discovery to translation as one of the most important opportunities for spatial biology. “Whether it’s in oncology, immunology, or neuroscience applications, the future of spatial biology is not simply just about generating more data; it’s translating increasingly sophisticated spatial discoveries into assays that can answer focused biological and clinical questions across large numbers of samples,” he says. “That requires a portfolio of complementary technologies. High-plex discovery platforms can reveal the complexity and heterogeneity of disease, while more focused and quantitative approaches can translate those findings into reproducible biomarkers and clinically relevant assays. Ultimately, the value of spatial biology will be measured by how effectively we can connect discovery to clinically actionable insights.”
From plex to precision
“Historically, spatial biology involved a fundamental tradeoff between plex, sensitivity, and resolution—researchers had to sacrifice one to gain another,” suggests Mike Miller, PhD, CTO and CPO at Quanterix. He says that is now shifting. “With today’s tools, those tradeoffs have narrowed considerably. The current challenge becomes building a platform that delivers reproducibility, rigor, and clinical-grade integrity at scale.”
The company is addressing those needs in several ways. Miller reports: “Our Akoya PhenoCycler-Fusion platform enables researchers to visualize and quantify 100+ proteins in a single tissue section at single-cell resolution.” The platform uses molecular barcoding chemistry. Miller elaborates: “Molecular barcoding is a way of identifying and measuring multiple proteins in a tissue while avoiding many of the limitations of traditional immunohistochemistry and conventional multiplexing approaches.”
Mike Miller, PhD Chief Technology Officer Quanterix
This approach combines three main components: an antibody that recognizes the target of interest; a unique molecular barcode, consisting of a short oligonucleotide sequence attached to the antibody; and a complementary oligonucleotide carrying a fluorescent reporter that binds to the barcode, enabling target visualization and quantification. “The key advantage is that the fluorescent reporter can be reversibly hybridized and removed without removing the antibody or repeatedly staining and stripping the tissue. This enables a cyclical imaging workflow.”
The company also recently introduced its PhenoCode2.0 chemistry as part of its new molecular barcoding kit, “which lets researchers reliably barcode virtually any antibody of their choice.” Miller continues: “This means researchers can easily expand and customize their biomarker panels to address new hypotheses, incorporate emerging biomarkers, and scale between unbiased discovery and targeted validation, accelerating the path to new insights.”
Beyond expanding what can be measured, Miller believes the next phase of spatial biology will focus on translating high-plex discoveries into larger, clinically relevant studies. “That’s ultimately what will separate platforms going forward, bridging the gap between generating a striking image in discovery and generating a measurement that holds up in a clinical trial or diagnostic setting.”
Next-generation sequencing (NGS) has matured into an essential part of modern drug development and diagnostic laboratories, and its steadily dropping costs are making it affordable for many facilities that a few years ago couldn’t justify the expense.
The coming years will build on that foundation by extracting more and different types of data from samples, leveraging AI both upstream and downstream, and streamlining workflow. The entire workflow—not just the sequencing itself—will become more cost effective, industry experts tell GEN.
The next wave
“The next major breakthrough in sequencing technology will likely come not from the sequencer alone, but from the ability to extract more meaningful biological insights from every sample,” Karen B. Chapman, PhD, associate VP, R&D Genomics, Agilent Technologies, says.
Karen B. Chapman, PhD Associate VP Agilent
She envisions “the convergence of improved long-read sequencing, intelligent assay design, AI-enabled analysis, and integrated automation across sample preparation, target enrichment, quality control, sample tracking, and data interpretation.”
Multiomics assays will likely be the next big thing.
Mark Van Oene President and CEO PacBio
“Sequencing has traditionally focused on the four canonical bases, but DNA molecules contain much more information, including methylation, damage, and secondary structure, that can reveal different layers of biology,” Mark Van Oene, president and CEO, PacBio, points out. “We see sequencing moving toward a rapid test that can deliver comprehensive, highly accurate results within hours, enabling scientists and clinicians to make decisions faster.”
The experts at New England Biolabs (NEB) concur. “That’s one of the next big opportunities in sequencing: to gather different data types and provide them in a way that allows them to be interpreted usefully in the context of the human genome,” Andrew Barry, associate director, product portfolio management, NEB, says.
Such multiomics assays will “enable richer and more comprehensive biological insights,” Lakmal Jayasinghe, PhD, CSO, Oxford Nanopore Technologies, says. “The next major breakthrough will be the ability to analyze DNA, RNA, and proteins on a common sensing platform along with epigenetics, epitranscriptomics, and post-translational modifications of proteins. The next frontier is understanding how that code is regulated and executed in real biological systems. We see proteomics as a key part of that future.”
As the industry pushes current boundaries, it is also working to improve sequencing performance through parallel workflows and automation that can accommodate a broad range of samples. Opportunities exist “to increase throughput, improve fidelity, and simplify workflows,” Jayasinghe adds.
To that end, Keerthana “Kit” Krishnan, director, NGS applications and product development, NEB, points out: “Library prep may need a bit more work.” On the upstream side, she identifies sample extraction and sample prep as areas with opportunities for improvement. Downstream opportunities, she says, are in data analysis.
For NGS to become a routine clinical tool, however, those analyses must be clinically meaningful and linked to follow-up actions, she says. She envisions NGS assay kits that are tailored to specific clinical applications.
AI adds value today
“The real breakthrough,” Chapman of Agilent Technologies points out, “will be…in delivering deeper, more actionable biological insights in a way that is economically viable, operationally practical, and accessible to a broad range of laboratories and users. AI will play a critical role in enabling this vision, unlocking new possibilities that lower computational and labor costs while enhancing accuracy and increasing operational speed.”
As sequencing costs decline, steadily improving technology makes sequencing affordable for an increasing number of users. Photo provided by Nanopore. [Oxford Nanopore Technologies]
Across the board, instrument developers are leveraging AI both upstream and down. For example:
PacBio uses AI upstream to transform raw sequencing data into HiFi reads and to detect DNA modifications. Downstream applications include tertiary analysis, which Van Oene says can be used “to identify and prioritize genetic variants associated with rare disease.”
NEB’s bioinformatics team deploys AI for coding support, while the automation team is exploring its application to streamline multi-instrument automation processes for developers and for field application scientists to anticipate pitfalls customers may face. AI is also becoming an important tool in enzyme discovery.
Agilent uses AI to learn from large datasets and develop ways to improve probe placement and target-enrichment design to enhance specificity, coverage and uniformity. Other applications may include “improving base calling, variant detection, structural variant characterization, methylation assessment and clinical interpretations,” Chapman says.
Oxford Nanopore uses AI to help build more accurate models and to directly detect DNA and RNA modifications. Looking ahead, “AI will become increasingly important in helping scientists, clinicians, and biopharma companies interpret complex multiomics datasets,” Jayasinghe says.
Illumina has embedded AI tools in its secondary analysis pipeline and throughout its software and informatics portfolio. It has also created the peer-reviewed Primate, Splice and Promoter AI genomic models.
Future AI value
Algorithms are moving “beyond simple rule-based design and increasingly learn from large datasets to optimize enrichment performance,” Chapman says. “Over time, these approaches could evolve into fully-AI-driven panel design systems that automatically optimize probe selection, predict assay performance, minimize sequencing costs, and continuously improve…as more data becomes available.”
“Looking ahead, the most transformative role for AI may be guiding researchers toward the right biological signals to measure, rather than merely processing larger volumes of data,” she continues. “AI can help to identify the most relevant genomic regions, uncover intricate molecular patterns, integrate genomic and methylation information, and bridge genomics discoveries with protein, cellular, and metabolic biology.”
Andrew Barry Associate Director New England Biolabs
As AI becomes increasingly ubiquitous, explainable AI will become a requirement, these experts agree. The ability to interrogate, assess, and validate the AI’s reasoning is imperative not only for on-instrument applications such as base-calling, but especially for tertiary analysis where understanding the evidence behind a result is critical.
As Barry says, “To use AI effectively, we have to know what’s going on underneath the hood.”
Continuing, overall cost reduction
The lab cost of genome sequencing broke $100 two years ago, and some labs are advertising 30x whole-genome sequencing and analysis for about $500. And, Van Oene from PacBio says, “There is potential to drive the cost of whole-genome sequencing down by another order of magnitude.”
For example, Van Oene says that increasing sample throughput offers a major opportunity “to reduce instrument amortization by spreading the cost of the instrument across many more genomes.” Other opportunities are emerging through computing advances that speed processing and analysis as well as through improvements in compute logistics, such as data compression, which reduces storage requirements, and cloud computing, which reduces hardware requirements and expands access to data.
“The sequencing part of it is becoming a smaller part of the total cost of a workflow,” Fiona Kaper, PhD, VP, head of assay R&D, Illumina, points out.
So, rather than focusing solely on reducing the cost of sequencing itself, NGS innovators increasingly are targeting efficiencies across the entire workflow, from improving sequencing performance and optimizing library preparation to expanding multiplexing capabilities that generate more insight from every run. “Ultimately,” Chapman, Agilent Technologies, says, “the industry’s focus will shift from the cost of sequencing a genome to the cost of delivering a clinically meaningful answer.”
“There’s still some meat left on the bone in terms of how you can improve some workflows,” Barry, NEB, observes.
Scalability is one example. The challenge of sequencing and analyzing a genome varies by size, and solutions need to address that. Therefore, scaling the upstream environment to meet the need is a key consideration for some instrument makers, along with logistical enhancements, such as lyophilization and assay formats, to improve ease of use globally.
Multiomics and multimodal assays two other examples. “We see a lot more customers starting to layer in additional information like proteomics, transcriptomics, and spatial and single cell analysis,” Kaper says.
Kit Krishnan Director New England Biolabs
This trend suggests a future, modular, environment in which scientists can select and optimize the assays that best address their questions. “Having a black box [solution]…really doesn’t work for everyone,” Krishnan underscores.
Further cost reductions, these experts agree, will stem from automating and consolidating workflows, effectively multiplexing assays and developing multimodal assays to generate more actionable information with each run. Such simplification extends to library preparation, which has expanded from DNA and RNA to include proteomics and data from spatial and single-cell analysis.
Instruments developers also are reducing the quantities of reagents needed. Consequently, Van Oene says, “Reducing reagent volumes in library preparation and sequencing will lower consumable costs as well as shipping and storage requirements—which people don’t usually think about when they think about the cost of a genome.”
“Time is also a form of cost,” Kaper says. The industry recognizes that by increasing data quality, capabilities, and sequencing speed to help its users do more, better, and faster.
“The goal,” as Jayasinghe of Oxford Nanopore Technologies says, “is to help customers derive meaningful answers faster, with fewer steps and greater efficiency.”
Ubiquitous sequencing
Fiona Kaper, PhD Vice President Illumina
Five to ten years from now, NGS may well be the core technology for research and clinical labs both, Kaper, Illumina, predicts. “Anything that has to do with the genome, like oncology, could really benefit from technologies that interrogate the genome and also the epigenome, proteome, etc.,” she says.
“Ultimately, the goal is not simply a cheaper genome, but a more informative genome, at a much lower cost,” Van Oene concludes.
The team from the Science study was led by co-senior authors Jay Shendure, PhD, professor of genome sciences at the University of Washington School of Medicine and a Howard Hughes Medical Institute investigator, and Chengxiang Qiu, PhD, a molecular and systems biologist at Dartmouth College. Their approach centered on DNA Typewriter, a lineage-tracing technology developed by Shendure and Junhong Choi, PhD, that uses a cell’s DNA as a recording medium.
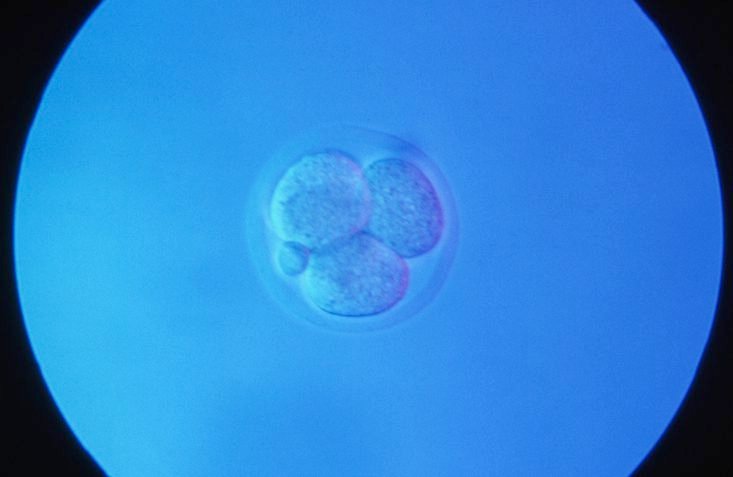
The researchers redesigned the system’s recording “tape” to make its history easier to recover from individual cells, then inserted it into the genome of a fertilized mouse egg. As cells divided, “a burst of editing unequivocally marks the daughters of the first cleavage, which serve as inline replicates,” the authors wrote in the Science paper. Because daughter cells inherited the marks already written before acquiring new ones, shared patterns revealed common ancestry and the order of developmental branching.
DNA Typewriter is injected into the genetic material of a fertilized mouse egg. This technology taps into the genetic material in the fertilized egg and resulting embryonic cells as a recording device of the cells’ histories. It tracks their relationships as the embryo develops. [Kyle O’Conner/Seattle Hub for Synthetic Biology]
“Most biological measurements are based on either live imaging, which is limited by the fact that most animal tissues are not transparent, or genomics, which are destructive and only measure a single timepoint,” Shendure said. “Recording techniques like the ones in these studies enable measurements over time including in settings that we can’t directly visualize.”
The experiment was attempted in 100 fertilized eggs and yielded 10 embryos for examination. One embryo carried the most informative record, allowing the team to trace nearly every profiled cell back to one of the first two cells formed after the fertilized egg divided. Although one founding cell produced more descendants, the two branches generated diverse cell types in nearly equal proportions.
The ordered recording also allowed the researchers to estimate when cell types diverged from shared developmental paths. Blood and retinal cells committed relatively early, whereas cells forming the skin’s outer layer committed later. The results indicate that cell identity is not fixed in a single coordinated step; instead, different lineages become restricted on distinct schedules.
Earlier lineage-tracing approaches often relied on DNA-cutting enzymes that could damage cells, erase previous records, exhaust recording capacity, or leave unordered marks whose chronology had to be inferred. “DNA Typewriter avoids all of this,” said co-first author Haedong Kim, PhD, a postdoctoral scientist in genome sciences at UW Medicine. “It writes without fully severing the DNA, keeps recording relatively steadily, and writes everything in strict order, so we can record cell lineages at much higher resolution for a longer time.”
In the Cell paper, Jonathan Weissman, PhD, and colleagues used a prime-editing system called PEtracer to map lineage dynamics across more than 1.4 million cells from 16 mouse embryos. Together with the DNA Typewriter study in Science, the work demonstrates that mammalian cellular family trees can be reconstructed at unprecedented scale. “It’s really proof of principle that we can do what was done with the roundworm in 1983, but for mammals like you and me,” Weissman said.
The work provides a framework for investigating how normal organs form and where development can go awry. More complete lineage records could help researchers study congenital malformations, neurodevelopmental and genetic disorders, and cancer, as well as guide stem cell engineering. As Shendure explained, “Recording techniques like the ones in these studies enable measurements over time including in settings that we can’t directly visualize.” Scaling the methods across additional embryos and experimental conditions could support more quantitative—and eventually predictive—models of mammalian development.
The Era of Modality Convergence: Why Drug Development Is Being Rewritten
The life sciences industry is entering a new era, defined not by a single breakthrough technology but by the convergence of many. Artificial intelligence is accelerating drug discovery, cell and gene therapies are expanding treatment possibilities, and antibody engineering continues to evolve beyond traditional monoclonal antibodies. Meanwhile, mRNA platforms, viral vectors, antibody-drug conjugates (ADCs), multispecific antibodies, and other advanced therapeutic modalities are transforming how developers approach previously intractable diseases. Taken individually, each of these innovations represents a significant advancement. Together, they are reshaping the drug development landscape.
For decades, therapeutic development followed a familiar path: identify a target, optimize a lead candidate, advance through preclinical studies, and move into clinical evaluation. While the science was challenging, the overall framework remained relatively consistent. Today, that framework is evolving rapidly. Developers are no longer limited to choosing between small molecules and conventional biologics. Instead, they have access to a growing toolkit of therapeutic technologies, each with unique advantages, manufacturing requirements, analytical challenges, and regulatory considerations. At the same time, advances in computational biology and AI-driven discovery are generating more candidates than ever before.
As a result, the challenge is no longer simply finding promising molecules. Increasingly, success depends on identifying candidates that can be manufactured, scaled, and translated into viable therapies. Decisions once reserved for later stages, including developability, manufacturability, analytical characterization, and clinical strategy, must now be addressed much earlier in the process. Drug development is becoming a continuous, interconnected journey rather than a series of separate steps.
The boundaries between traditional disciplines are also beginning to blur. Cell therapies may incorporate viral vectors. Gene therapies may leverage lipid nanoparticles. Antibody programs may evolve into multispecific or conjugated formats. The future of drug development is not defined by any single modality, but by the ability to integrate technologies effectively.
Organizations that combine discovery expertise, modality-specific knowledge, CMC capabilities, and manufacturing execution will be best positioned to navigate this increasingly complex environment. The articles that follow examine key trends driving this transformation, from AI-enabled discovery and experimental validation to advanced cell, gene, and biologic platforms, and explore how the next generation of therapies will move from concept to clinic.
Sophie, a 12-year-old dog, isn’t sure what to make of the much larger Homer after Dog Aging Project co-lead and ASU Professor Noah Snyder-Mackler delivered his lecture to residents at Mirabella at ASU on Thursday, August 6, 2026. Sophie lives at Mirabella with her owner, Bonnie Kasel. Snyder-Mackler and his fellow researchers study various health markers in dogs as they age. [Charlie Leight/ASU News]
Domestic dogs offer a useful model for understanding the biology of aging because their lifespans vary dramatically with body size. Large dogs tend to be shorter lived than their smaller counterparts, but why? Headed by a team at Arizona State University, a study of nearly 900 dogs now suggests that the answer may be written into the animals’ epigenomes.
Research professor Noah Snyder-Mackler, PhD, at Arizona State University School of Life Sciences, and colleagues developed an epigenetic clock that predicted mortality in dogs and showed that epigenetic aging is fastest early in life. The study results indicated that male dogs and larger dogs undergo accelerated molecular aging, with male dogs exhibiting pronounced DNA methylation (DNAm) changes on the X chromosome, and larger animals exhibiting methylation changes at transposable elements (TEs), stretches of DNA that can influence genome stability and gene regulation.
Snyder-Mackler is senior and corresponding author of the researchers’ published paper in Science (“Epigenetic aging and transposon dysregulation reflect size-related lifespan compression in dogs,”) in which they concluded, “Our findings broadly establish companion dogs as a translational model for uncovering molecular mechanisms of lifespan variation, epigenomic instability, and age-related disease.”
Genome-wide DNA methylation in 894 dogs from the Dog Aging Project reveals accelerated aging in larger dogs and faster loss of repression of transposable elements. [Blaise Mariner & Brianah McCoy]
Aging is a universal process, but its pace and biological mechanisms substantially differ between individuals within even the same species, the authors wrote. “Whether shorter-lived individuals simply die earlier or instead experience accelerated biological aging throughout life remains unclear,” they noted. And while comparative studies across species have identified mechanisms associated with exceptional longevity, they may not be as well suited to identifying the molecular drivers of aging variation. “Domestic dogs provide a model for addressing this challenge because body size strongly predicts lifespan, with larger breeds living substantially shorter lives than smaller breeds despite sharing many physiological and environmental conditions,” the team continued.
In fact, smaller breeds can live nearly twice as long as larger breeds. And companion dogs live in human environments, consume commercial diets, and receive routine medical care, making them a relevant translational model for studying how genetic background and environmental exposures shape aging, the investigators pointed out.
Professor and School of Life Sciences Associate Director Noah Snyder-Mackler poses for portraits with his two dogs, 7-year-old Homer, bottom, and 4-year-old Juno, top, on the steps of Old Main on the ASU Tempe campus on Monday morning, September 28, 2026. Snyder-Mackler’s recent research focuses on dog epigenetics. [Deanna Dent/Arizona State University]
But how intrinsic factors such as size and biological sex influence variation in dog aging and lifespan remains unclear. “It is well established that size and sex influence lifespan in dogs, but it remains unclear whether shorter-lived dogs experience accelerated epigenetic aging,” they stated. Previous research has demonstrated that DNAm is a useful indicator of biological aging, with “epigenetic clocks” offering a way to understand the factors that accelerate or decelerate biological aging. “DNA methylation (DNAm) has emerged as a robust molecular biomarker of age, with ‘epigenetic clocks’ offering a quantitative framework for identifying factors that accelerate or decelerate biological age.”
For their newly reported study Snyder-Mackler, together with first author Blaise Mariner, PhD, and colleagues generated 1,640 methylomes from a cohort of 894 dogs in the Dog Aging Project. They combined the molecular data with detailed genetic and demographic data. The results indicated that molecular aging occurs most rapidly early in a dog’s life. The study also found that larger and male dogs—both of which have shorter lifespans than their respective counterparts—age more quickly at the molecular level.
The authors identified different epigenetic patterns underlying these effects. According to the findings, sex-related changes were concentrated on the X chromosome, while body-size-related changes were especially prominent in TEs. “Thus, size and sex, two axes associated with shorter expected lifespan in dogs, appear to shape aging through partially distinct epigenetic architectures,” they stated. “Larger dogs show greater methylation loss at TEs with age, consistent with increased immune remodeling and genomic instability … These data address a major gap in comparative epigenomics by providing evidence that, within a species, demographic groups with shorter expected lifespans show faster epigenetic aging.”
 Detection of the whole transcriptome along with over 64 proteins in a human breast cancer FFPE tissue section using Bruker’s CosMx spatial molecular imager. [Bruker Spatial Biology]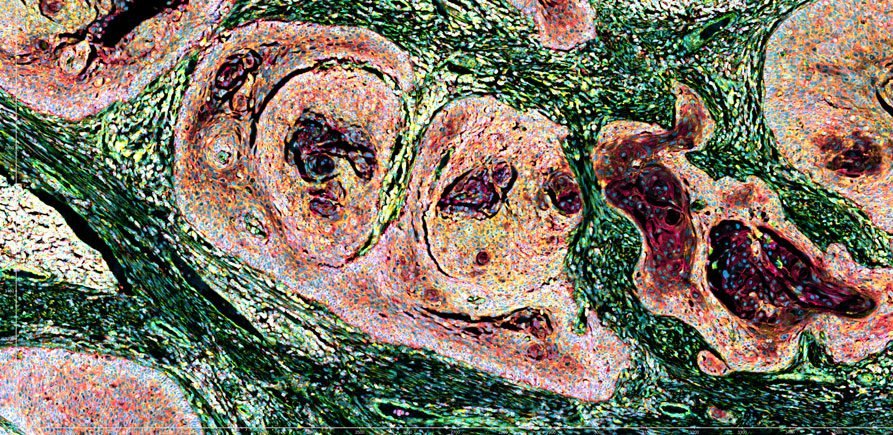











![Genome-wide DNA methylation in 894 dogs from the Dog Aging Project reveals accelerated aging in larger dogs and faster loss of repression of transposable elements. [Blaise Mariner & Brianah McCoy]](https://www.genengnews.com/wp-content/uploads/2026/10/low-res-3-300x169.jpeg)